INFINITY TURBINE LLC We specialize in designs, plans, licensing, consulting, design services, and surplus spare parts. We no longer manufacture turbines or CO2 systems. More Info...
TEL: +1-608-238-6001 (Chicago Time Zone ) USA
Email: greg@infinityturbine.com
CO2 Ejectors for Data Center Waste Heat Cooling: A Technical Review Hyperscalers are racing to deploy gigawatts of AI compute, but the grid can't keep up and large gas turbines are backordered half a decade out. Infinity Turbine's Cluster Mesh Supercritical CO₂ system offers a radical alternative: modular, silent, trailer-deployable prime power that scales the way software does... More Info
Turning AI Data Center Waste Heat Into Electricity More Info
Cooling a Data Center Pod with Its Own Waste Heat: A 100 kW Ejector Design Study More Info
Portable Gas Turbine Prime Power AI data centers are pushing electrical infrastructure to its limits. The traditional AC power chain is no longer optimal for GPU-driven workloads. A DC-native architecture using Infinity Turbine’s Cluster Mesh system offers a path to higher efficiency, lower costs, and scalable modular power—potentially saving tens of millions per year at hyperscale... More Info
SMR and Cluster Mesh Supercritical CO2 Power System for Data Centers and AI Pairing Cluster Mesh Supercritical CO2 Power System with Small Modular Reactors enables hyperscalers to convert high-grade nuclear heat into ultra-efficient, dispatchable power with a compact, modular footprint tailored for AI-scale demand. More Info
ORC and Products Index Infinity Turbine ORC Index... More Info
AMD Helios Cooling Strategy Using Transcritical CO2 and a Cluster Mesh sCO2 Turbine Generator Cell More Info
|
|
|
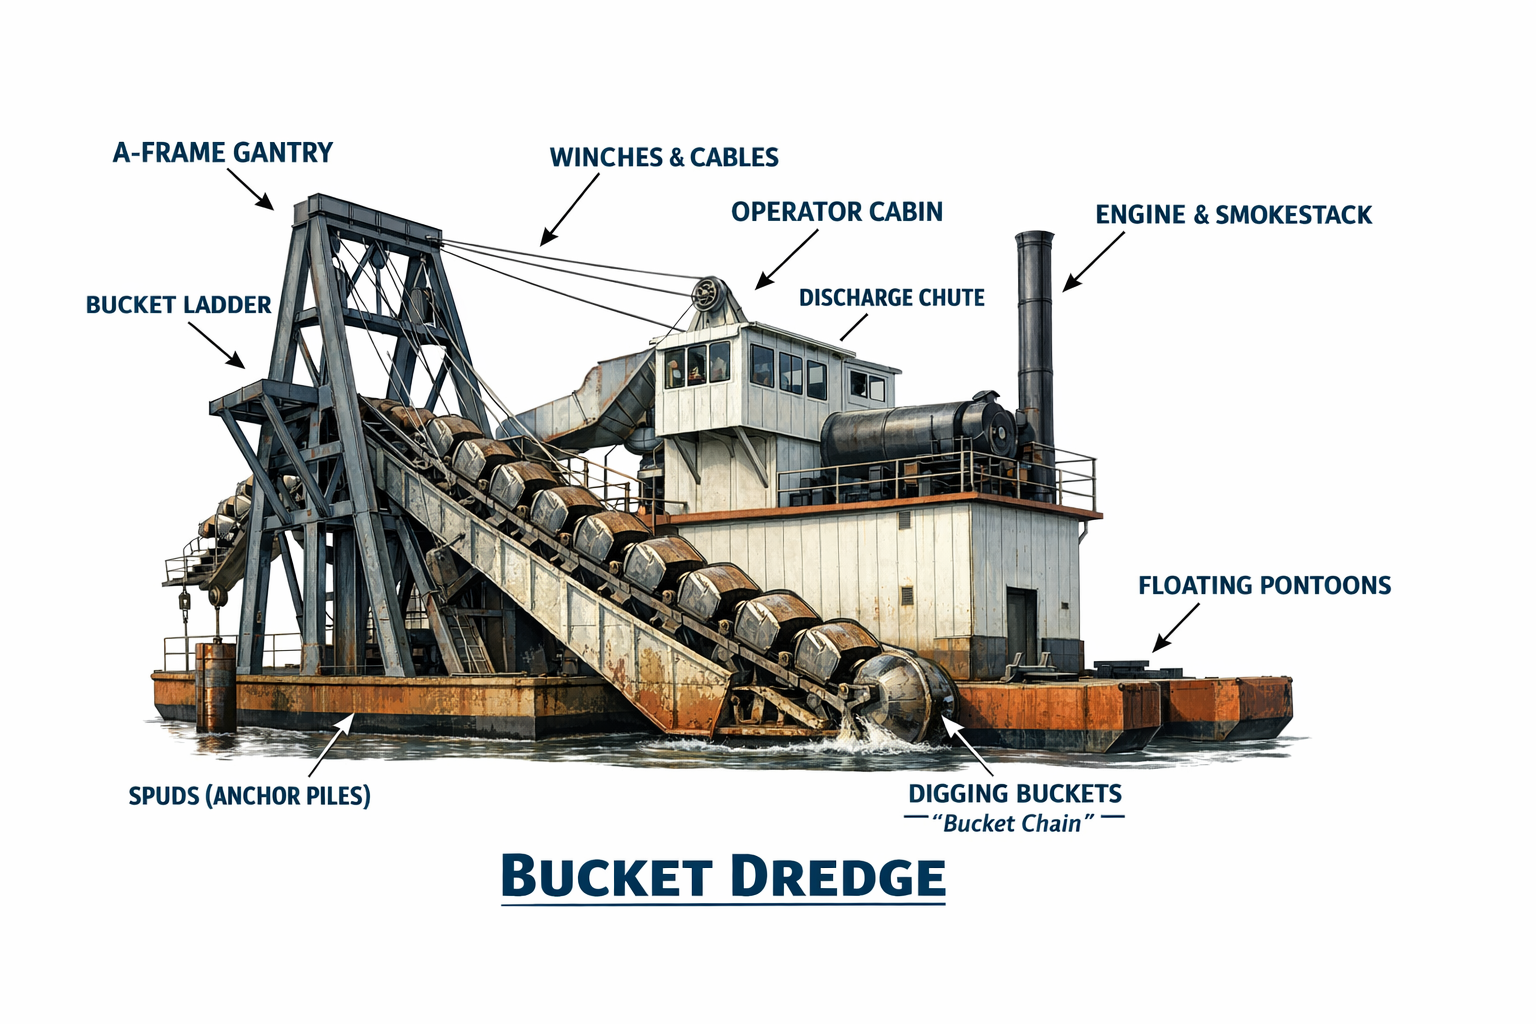
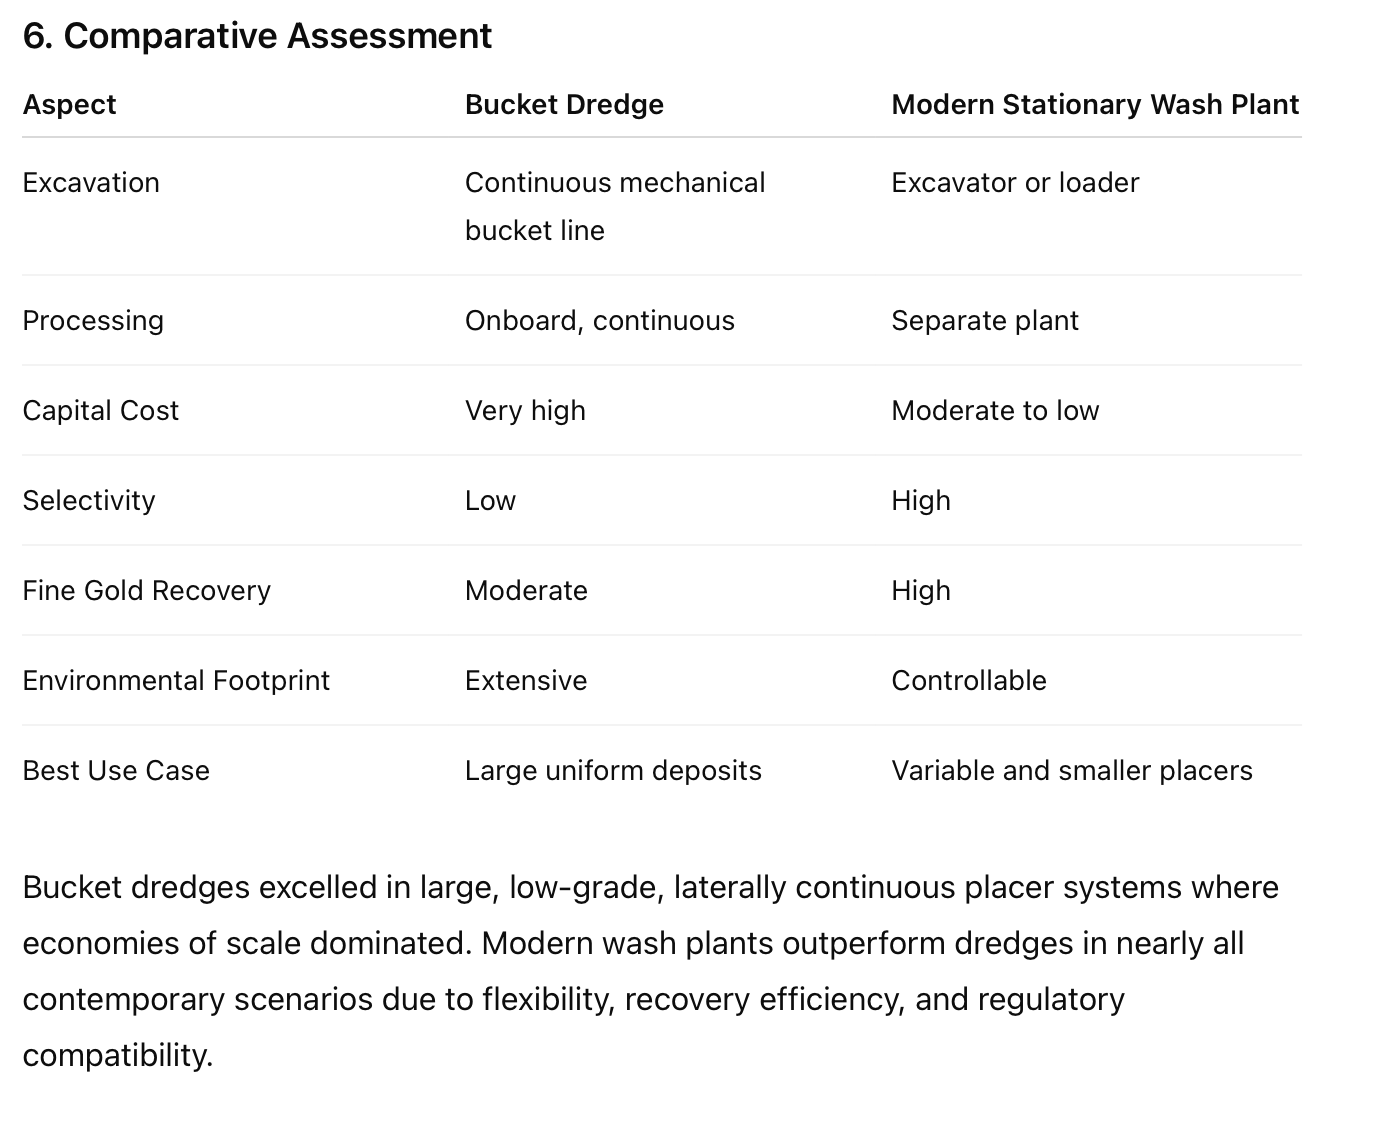
Bucket-Line Dredge Placer Mining Operation, Components, Efficiency, and Comparison to Modern Stationary Wash Plants1. Overview of Bucket Dredge OperationsBucket-line dredges were the dominant large-scale placer mining technology from the late 19th century through the mid-20th century, particularly in Alaska, California, and the Yukon. These floating mechanical systems were designed to mine unconsolidated alluvial gravels continuously, excavating material from below water level, processing it onboard, and discharging tailings behind the dredge as it advanced through a placer deposit .Unlike modern land-based operations, bucket dredges combined excavation, transport, classification, gold recovery, and tailings disposal into a single continuous system operating from a floating hull.2. Major Components of a Bucket-Line DredgeA typical bucket dredge consisted of the following integrated subsystems:Bucket Line and LadderA continuous chain of steel buckets mounted on a ladder excavated gravels from the pond floor. Bucket capacities historically ranged from roughly 2 to over 18 cubic feet, with digging depths commonly exceeding 60 to 100 feet in favorable ground .Hull and Spud SystemThe dredge floated in a pond created by its own excavation. Large spuds or anchors stabilized the hull while allowing controlled forward movement during digging cycles.Screening and Washing PlantExcavated material was dumped into a rotating trommel or screen where oversize material was rejected and stacked behind the dredge. Undersize material flowed to sluice boxes or jigs for gravity separation of gold.Gold Recovery CircuitPrimary recovery relied on sluices with riffles, followed by secondary recovery devices such as jigs or tables. Mercury amalgamation was historically common, though now obsolete due to environmental restrictions .Stacker and Tailings DisposalOversize tailings were conveyed by stackers and deposited behind the dredge, forming characteristic windrow tailings piles that marked the dredge’s advance.3. Operating Efficiency and PerformanceBucket dredges achieved very high material throughput and low unit costs when operating in large, continuous placer deposits:• Throughput: Hundreds to several thousand cubic yards per day, depending on bucket size and operating speed• Recovery: Historical recovery rates typically ranged from 70–85 percent, improving with better screening and cleanup practices; later operations achieved higher recovery but still struggled with very fine gold • Cost Efficiency: Once mobilized, dredges exhibited low cost per cubic yard due to continuous operation and minimal labor per unit volume However, dredges required large, laterally extensive deposits with relatively uniform grades to justify their high capital cost and long setup timelines.4. Limitations of Bucket Dredge MiningDespite their scale advantages, bucket dredges suffered from several structural and economic limitations:• Capital Intensity: High upfront construction and mobilization costs• Low Selectivity: Dredges mined everything in their path, including low-grade material, reducing efficiency in heterogeneous deposits• Environmental Impact: Extensive landscape disturbance, stream realignment, and tailings piles led to significant long-term reclamation issues • Operational Inflexibility: Poor suitability for narrow pay streaks, shallow placers, or environmentally restricted areasThese limitations contributed to the decline of dredging after World War II as operating costs rose and regulatory constraints tightened.5. Modern Stationary Placer Wash PlantsContemporary placer mining largely relies on stationary or semi-mobile wash plants fed by excavators, loaders, or hydraulic monitors. These systems separate excavation from processing, allowing greater operational flexibility.Key Characteristics:• Modular Equipment: Trommels, vibrating screens, sluices, jigs, and centrifugal concentrators• Selective Mining: Operators can target specific pay gravels and avoid waste• Lower Capital Cost: Substantially less upfront investment compared to dredges• Improved Fine Gold Recovery: Modern concentrators recover gold well below historical dredge limits Wash plants are typically paired with settling ponds and water recycling systems to meet modern environmental requirements.6. Comparative Assessment| Aspect | Bucket Dredge | Modern Stationary Wash Plant || ----------------------• | --------------------------------• | ---------------------------• || Excavation | Continuous mechanical bucket line | Excavator or loader || Processing | Onboard, continuous | Separate plant || Capital Cost | Very high | Moderate to low || Selectivity | Low | High || Fine Gold Recovery | Moderate | High || Environmental Footprint | Extensive | Controllable || Best Use Case | Large uniform deposits | Variable and smaller placers |Bucket dredges excelled in large, low-grade, laterally continuous placer systems where economies of scale dominated. Modern wash plants outperform dredges in nearly all contemporary scenarios due to flexibility, recovery efficiency, and regulatory compatibility.7. ConclusionBucket-line dredges represent the peak of early industrial placer mining engineering, capable of extraordinary production rates and low unit costs under ideal geological conditions. However, their rigidity, environmental impact, and capital intensity rendered them obsolete as placer mining shifted toward selective, lower-impact operations.Modern stationary wash plants, while smaller in scale, achieve higher overall recovery, better adaptability, and regulatory compliance. As a result, today’s placer mining emphasizes precision and efficiency over sheer throughput, marking a clear technological and economic evolution from the dredge era . |
|
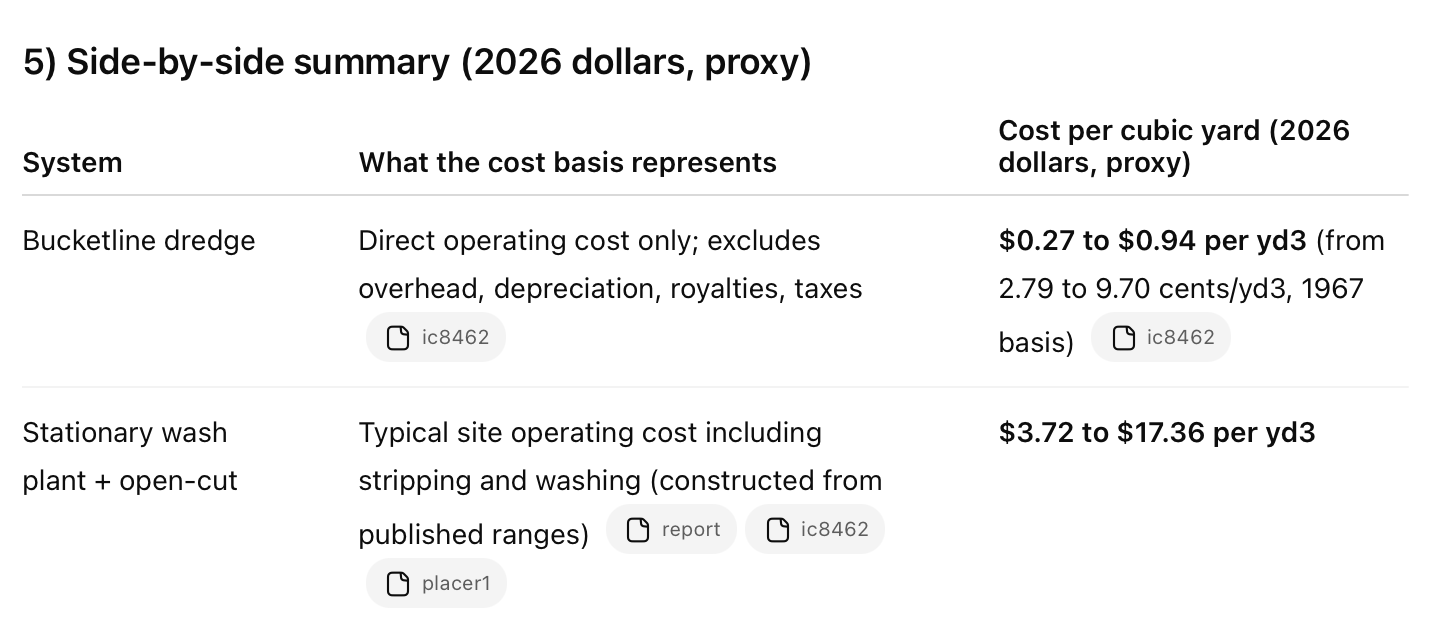
Cost per cubic yard in 2026 dollars: bucketline dredge versus modern stationary wash plant Cost per cubic yard in 2026 dollars: bucketline dredge versus modern stationary wash plant1) What cost per cubic yard means hereTwo different cost conventions show up in the historical dredge literature versus modern placer practice:• Bucketline dredge source data commonly reports direct operating costs only (labor, power, supplies, maintenance) and explicitly excludes overhead and administration, depreciation, royalties, and taxes. • By contrast, modern $ per yard figures miners quote for stationary plants are often all-in site operating cost for mining and washing (and sometimes include stripping, water handling, etc.). The Alaska placer profile literature also separates stripping/overburden from processing. To quantify apples-to-apples, I provide:1. Dredge direct operating cost per yd3 (then a practical all-in range note), and2. Modern stationary plant operating cost per yd3, using published historic ranges plus typical stripping, converted to 2026 dollars.2) Inflation basis used (to express everything in 2026 dollars)Because full-year 2026 CPI is not yet available, I used BLS CPI-U index level for December 2025 (324.054, 1982-84=100) as a near-term proxy for 2026 dollars. ([Bureau of Labor Statistics][1])Key CPI anchors:• 1967 annual average CPI-U = 33.4 ([Bureau of Labor Statistics][2])• 1990 annual average CPI-U = 130.7 ([Bureau of Labor Statistics][2])• Dec 2025 CPI-U index level = 324.054 ([Bureau of Labor Statistics][1])Inflation multipliers:• 1967 to 2026 proxy: 324.054 / 33.4 = 9.70x• 1990 to 2026 proxy: 324.054 / 130.7 = 2.48x3) Bucketline dredge: quantified cost per cubic yard (2026 dollars)A. Direct operating cost examples (historical, updated-to-1967-cost basis)The USBM dredge dataset reports total direct cost in cents per cubic yard for multiple standard-speed dredges, with the explicit exclusions noted above. Example values for 9-cubic-foot dredges include 2.79 to 9.70 cents per yd3. Converted to 2026 dollars (proxy), using 9.70x:• Low case: 2.79 cents/yd3 (1967) = $0.0279/yd3 (1967) -> $0.27/yd3 (20 cents/yd3 (1967) = $0.0970/yd3 (1967) -> $0.94/yd3 (2026)Interpretation:• T• range is direct operating cost, not a complete project cost.B. Practical all-in noteBecause the dredge figures exclude overhead, admin, depreciation, royalties, and taxes , a practical all-in mining cost for a dredge-based project will be higher. How much higher depends on:• capital intensity and financing structure,• mobilization, camp, permitting,• pond/stacker management, reclamation,• downtime and spae-of-thumb uplift for all-in can be on the order of 1.5x to 3x direct operating cost for capital-heavy continuous operations (site-dependent). I am not asserting a single universal multiplier; the key point is that the reported dredge cents-per-yard are intentionally incomplete by design. 4) Modern stationary wash plants: quantified cost per cubic yard (2026 dollars)The Alaska placer mining summary reports that in the 1980s and 1990s (gold $300 to $400/oz), costs ranged from $0.50 to $5.00 per cubic yard•site conditions. Separately, the Alaska placer profile indicates stripping overburden costs between $1 and $2 per yard at most mines, site-dependent. A reasonable modern stationary plant, typical open-cut operatfore:• Processing (wash plant + mining + water handling): $0.50 to $5.00 per yd3 • Plus stripping: • Total operating range (1990-era dollars, approximate): $1.50 to $7.00 per yd3Convert to 2026 dollars (proxy) using 2.48x (1990 to 2026 proxy):• 3.72/yd3 (2026)• High case: $7.00/yd3 -> nge is intentionally broad because the source range is broad and site conditions dominate (haul distances, water recirculation, clay content, freeze-thaw constraints, fuel logistics, etc.).5) Side-by-side summary (2026 dollars, proxy)| System | What the cost basis represents | Cost per cubic yard (2026 dollars, proxy) || -------------------------------• | -----------------------------------------------------------------------------------------------• | --------------------------------------------------------------------• || Bucketline dredge | Direct operating cost only; excludes overhead, depreciation, royalties, taxes | $0.27 to $0.94 per yd3 (from 2.79 to 9.70 cents/yd3, 1967 basis) || Stationary wash plant + open-cut | Typical site operating cost including stripping and washing (constructed from published ranges) | $3.72 to $17.36 per yd3 |unce does to break-even grade (useful planning metric)Assume 90 percent recovery (consistent with modern claims that, depending on tBreak-even grade (oz/yd3) = Cost per yd3 / (Gold price per oz x Recovery)At $5,000/oz and 90 percent recovery:• Dredge direct operating cost basis • $0.27/yd3 -> 0.000060 oz/yd3 (about 0.0019 g/yd3) • $0.94/yd3 -> 0.003)• Modern stationary plant operating range (incl stripping) • $3.72/yd3 -> 0.000827 oz/yd3 (about 0.0257 g/yd3) • $17.36/yd3 -> 0.003858 oz/yd3 (about 0.1200 g/yd3)Two cautions:1. The dredge grade thresholds above are only on a direct operating basis (not full cost). 2. Real-world cutoffs must include dilution, downtime, tailings management, permitting, reclamation, and working capital.Bottom line• On a direct operating cost per cubic yard basis, historical bucketline dredges can be exontinuous, high-throughput conditions: about $0.27 to $0.94 per yd3 in 2026 dollars (proxy) based on published dredge cost tables updated to 1967 cost levels. • Modern stationary wash plants (open-cut + plant + typical stripping) generally land one order of magnitude higher, roughly $3.7 to $17.4 per yd3 (2026 dollars, proxy) using published 1980s to 1990s cost ranges plus typical • At $5,000/oz gold, the implied grade cutoffs can drop materially, but the decision is usually dominated by permitting, water management, reclamation liability, and capital availability, not just t the comparison into a feasibility-style worksheet: inputs for throughput (yd3/hr), season length, headcount, diesel price, strip ratio, and recovery to generate a site-specific $/yd3 and $/oz cost curve for each approach.[1]: https://www.bls.gov/news.release/pdf/cpi.pdf Consumer Price Index • December 2025[2]: https://www.bls.gov/cpi/tables/supplemental-files/historical-cpi-u-202402.pdf Consumer Price Index • February 2024 |
|
| CONTACT TEL: +1-608-238-6001 (Chicago Time Zone USA) Email: greg@infinityturbine.com | AMP | PDF |