PDF Publication Title:
Text from PDF Page: 190
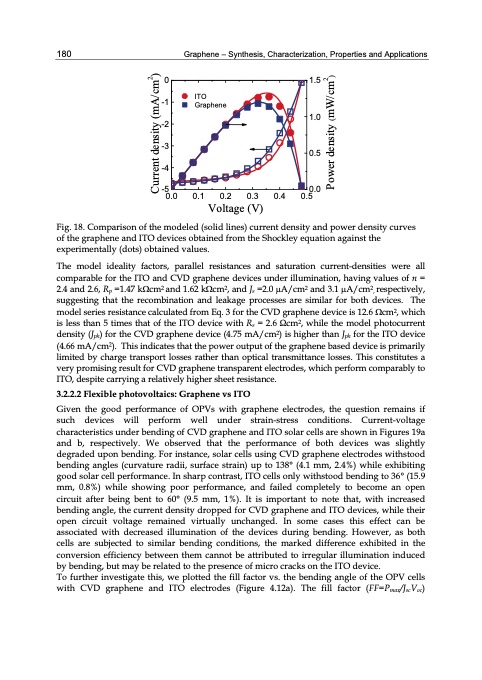
180 Graphene – Synthesis, Characterization, Properties and Applications 1.5 0 -1 -2 -3 -4 -5 0.0 0.1 0.2 0.3 1.0 0.5 0.0 0.4 0.5 Voltage (V) Fig. 18. Comparison of the modeled (solid lines) current density and power density curves of the graphene and ITO devices obtained from the Shockley equation against the experimentally (dots) obtained values. The model ideality factors, parallel resistances and saturation current-densities were all comparable for the ITO and CVD graphene devices under illumination, having values of n = 2.4 and 2.6, Rp =1.47 kcm2 and 1.62 kcm2, and Js =2.0 A/cm2 and 3.1 A/cm2, respectively, suggesting that the recombination and leakage processes are similar for both devices. The model series resistance calculated from Eq. 3 for the CVD graphene device is 12.6 cm2, which is less than 5 times that of the ITO device with Rs = 2.6 Ωcm2, while the model photocurrent density (Jph) for the CVD graphene device (4.75 mA/cm2) is higher than Jph for the ITO device (4.66 mA/cm2). This indicates that the power output of the graphene based device is primarily limited by charge transport losses rather than optical transmittance losses. This constitutes a very promising result for CVD graphene transparent electrodes, which perform comparably to ITO, despite carrying a relatively higher sheet resistance. 3.2.2.2 Flexible photovoltaics: Graphene vs ITO Given the good performance of OPVs with graphene electrodes, the question remains if such devices will perform well under strain-stress conditions. Current-voltage characteristics under bending of CVD graphene and ITO solar cells are shown in Figures 19a and b, respectively. We observed that the performance of both devices was slightly degraded upon bending. For instance, solar cells using CVD graphene electrodes withstood bending angles (curvature radii, surface strain) up to 138° (4.1 mm, 2.4%) while exhibiting good solar cell performance. In sharp contrast, ITO cells only withstood bending to 36° (15.9 mm, 0.8%) while showing poor performance, and failed completely to become an open circuit after being bent to 60° (9.5 mm, 1%). It is important to note that, with increased bending angle, the current density dropped for CVD graphene and ITO devices, while their open circuit voltage remained virtually unchanged. In some cases this effect can be associated with decreased illumination of the devices during bending. However, as both cells are subjected to similar bending conditions, the marked difference exhibited in the conversion efficiency between them cannot be attributed to irregular illumination induced by bending, but may be related to the presence of micro cracks on the ITO device. To further investigate this, we plotted the fill factor vs. the bending angle of the OPV cells with CVD graphene and ITO electrodes (Figure 4.12a). The fill factor (FF=Pmax/JscVoc) Current density (mA/cm2) Power density (mW/cm2) ITO GraphenePDF Image | GRAPHENE SYNTHESIS CHARACTERIZATION PROPERTIES
PDF Search Title:
GRAPHENE SYNTHESIS CHARACTERIZATION PROPERTIESOriginal File Name Searched:
Graphene-Synthesis.pdfDIY PDF Search: Google It | Yahoo | Bing
Salgenx Redox Flow Battery Technology: Power up your energy storage game with Salgenx Salt Water Battery. With its advanced technology, the flow battery provides reliable, scalable, and sustainable energy storage for utility-scale projects. Upgrade to a Salgenx flow battery today and take control of your energy future.
CONTACT TEL: 608-238-6001 Email: greg@infinityturbine.com (Standard Web Page)