
PDF Publication Title:
Text from PDF Page: 189
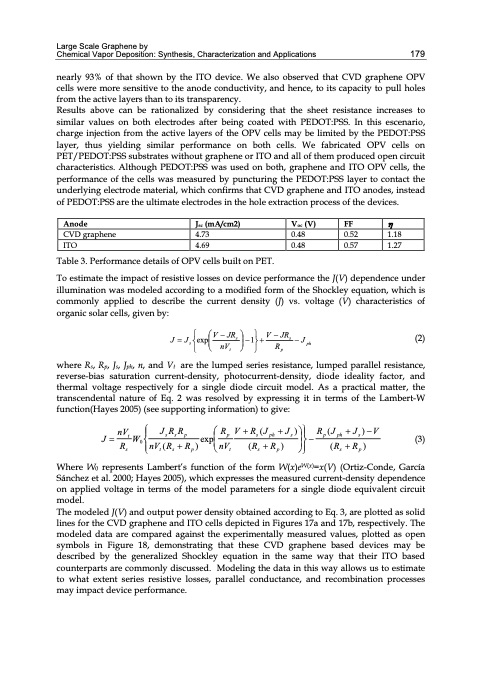
Large Scale Graphene by Chemical Vapor Deposition: Synthesis, Characterization and Applications 179 nearly 93% of that shown by the ITO device. We also observed that CVD graphene OPV cells were more sensitive to the anode conductivity, and hence, to its capacity to pull holes from the active layers than to its transparency. Results above can be rationalized by considering that the sheet resistance increases to similar values on both electrodes after being coated with PEDOT:PSS. In this escenario, charge injection from the active layers of the OPV cells may be limited by the PEDOT:PSS layer, thus yielding similar performance on both cells. We fabricated OPV cells on PET/PEDOT:PSS substrates without graphene or ITO and all of them produced open circuit characteristics. Although PEDOT:PSS was used on both, graphene and ITO OPV cells, the performance of the cells was measured by puncturing the PEDOT:PSS layer to contact the underlying electrode material, which confirms that CVD graphene and ITO anodes, instead of PEDOT:PSS are the ultimate electrodes in the hole extraction process of the devices. Anode CVD graphene ITO Jsc (mA/cm2) 4.73 4.69 Voc (V) 0.48 0.48 FF 0.52 1.18 0.57 1.27 Table 3. Performance details of OPV cells built on PET. To estimate the impact of resistive losses on device performance the J(V) dependence under illumination was modeled according to a modified form of the Shockley equation, which is commonly applied to describe the current density (J) vs. voltage (V) characteristics of organic solar cells, given by: VJRs VJRs (2) J J s exp nV 1 R J ph tp where Rs, Rp, Js, Jph, n, and Vt are the lumped series resistance, lumped parallel resistance, reverse-bias saturation current-density, photocurrent-density, diode ideality factor, and thermal voltage respectively for a single diode circuit model. As a practical matter, the transcendental nature of Eq. 2 was resolved by expressing it in terms of the Lambert-W function(Hayes 2005) (see supporting information) to give: JRR R VR(J J) R(J J)V JnVtW s s p exp p s ph s p ph s (3) R 0nV(R R ) nV (R R ) (R R ) stspt spsp Where W0 represents Lambert’s function of the form W(x)eW(x)=x(V) (Ortiz-Conde, García Sánchez et al. 2000; Hayes 2005), which expresses the measured current-density dependence on applied voltage in terms of the model parameters for a single diode equivalent circuit model. The modeled J(V) and output power density obtained according to Eq. 3, are plotted as solid lines for the CVD graphene and ITO cells depicted in Figures 17a and 17b, respectively. The modeled data are compared against the experimentally measured values, plotted as open symbols in Figure 18, demonstrating that these CVD graphene based devices may be described by the generalized Shockley equation in the same way that their ITO based counterparts are commonly discussed. Modeling the data in this way allows us to estimate to what extent series resistive losses, parallel conductance, and recombination processes may impact device performance.PDF Image | GRAPHENE SYNTHESIS CHARACTERIZATION PROPERTIES
PDF Search Title:
GRAPHENE SYNTHESIS CHARACTERIZATION PROPERTIESOriginal File Name Searched:
Graphene-Synthesis.pdfDIY PDF Search: Google It | Yahoo | Bing
Salgenx Redox Flow Battery Technology: Power up your energy storage game with Salgenx Salt Water Battery. With its advanced technology, the flow battery provides reliable, scalable, and sustainable energy storage for utility-scale projects. Upgrade to a Salgenx flow battery today and take control of your energy future.
| CONTACT TEL: 608-238-6001 Email: greg@infinityturbine.com | RSS | AMP |