PDF Publication Title:
Text from PDF Page: 188
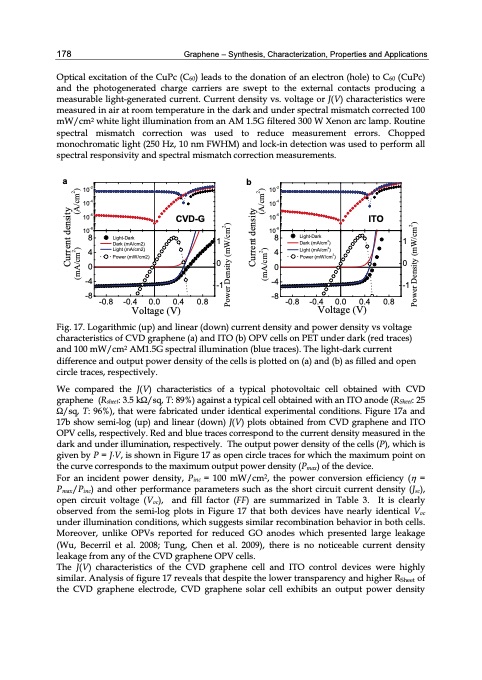
178 Graphene – Synthesis, Characterization, Properties and Applications Optical excitation of the CuPc (C60) leads to the donation of an electron (hole) to C60 (CuPc) and the photogenerated charge carriers are swept to the external contacts producing a measurable light-generated current. Current density vs. voltage or J(V) characteristics were measured in air at room temperature in the dark and under spectral mismatch corrected 100 mW/cm2 white light illumination from an AM 1.5G filtered 300 W Xenon arc lamp. Routine spectral mismatch correction was used to reduce measurement errors. Chopped monochromatic light (250 Hz, 10 nm FWHM) and lock-in detection was used to perform all spectral responsivity and spectral mismatch correction measurements. a b 10-2 10-4 10-6 10-2 10-4 10-6 10-8 0000 10-8 8181 44 -4 -1 -8 -0.8 -0.4 0.0 0.4 0.8 -4 -1 -8 -0.8 -0.4 0.0 0.4 0.8 Voltage (V) Voltage (V) Fig. 17. Logarithmic (up) and linear (down) current density and power density vs voltage characteristics of CVD graphene (a) and ITO (b) OPV cells on PET under dark (red traces) and 100 mW/cm2 AM1.5G spectral illumination (blue traces). The light-dark current difference and output power density of the cells is plotted on (a) and (b) as filled and open circle traces, respectively. We compared the J(V) characteristics of a typical photovoltaic cell obtained with CVD graphene (Rsheet: 3.5 kΩ/sq, T: 89%) against a typical cell obtained with an ITO anode (RSheet: 25 Ω/sq, T: 96%), that were fabricated under identical experimental conditions. Figure 17a and 17b show semi-log (up) and linear (down) J(V) plots obtained from CVD graphene and ITO OPV cells, respectively. Red and blue traces correspond to the current density measured in the dark and under illumination, respectively. The output power density of the cells (P), which is given by P = J·V, is shown in Figure 17 as open circle traces for which the maximum point on the curve corresponds to the maximum output power density (Pmax) of the device. For an incident power density, Pinc = 100 mW/cm2, the power conversion efficiency ( = Pmax/Pinc) and other performance parameters such as the short circuit current density (Jsc), open circuit voltage (Voc), and fill factor (FF) are summarized in Table 3. It is clearly observed from the semi-log plots in Figure 17 that both devices have nearly identical Voc under illumination conditions, which suggests similar recombination behavior in both cells. Moreover, unlike OPVs reported for reduced GO anodes which presented large leakage (Wu, Becerril et al. 2008; Tung, Chen et al. 2009), there is no noticeable current density leakage from any of the CVD graphene OPV cells. The J(V) characteristics of the CVD graphene cell and ITO control devices were highly similar. Analysis of figure 17 reveals that despite the lower transparency and higher RSheet of the CVD graphene electrode, CVD graphene solar cell exhibits an output power density CVD-G Light-Dark Dark (mA/cm2) Light (mA/cm2) Power (mW/cm2) ITO Light-Dark Dark (mA/cm2) Light (mA/cm2) Power (mW/cm2) Current density (mA/cm2) (A/cm2) Power Density (mW/cm2) Current density (mA/cm2) (A/cm2) Power Density (mW/cm2)PDF Image | GRAPHENE SYNTHESIS CHARACTERIZATION PROPERTIES
PDF Search Title:
GRAPHENE SYNTHESIS CHARACTERIZATION PROPERTIESOriginal File Name Searched:
Graphene-Synthesis.pdfDIY PDF Search: Google It | Yahoo | Bing
Salgenx Redox Flow Battery Technology: Power up your energy storage game with Salgenx Salt Water Battery. With its advanced technology, the flow battery provides reliable, scalable, and sustainable energy storage for utility-scale projects. Upgrade to a Salgenx flow battery today and take control of your energy future.
CONTACT TEL: 608-238-6001 Email: greg@infinityturbine.com (Standard Web Page)