PDF Publication Title:
Text from PDF Page: 129
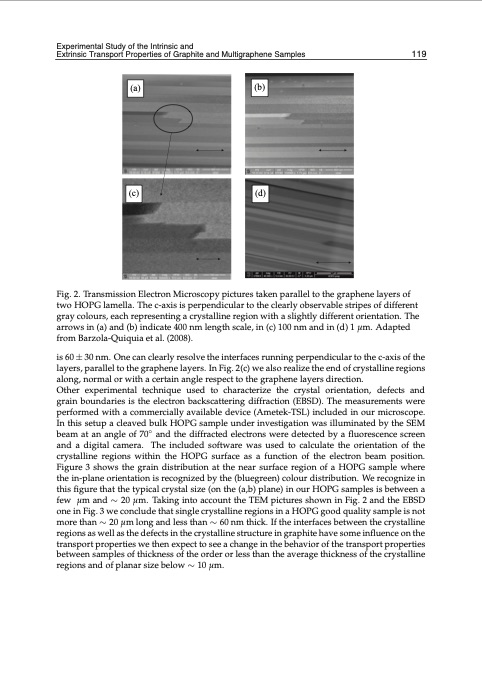
Experimental Study of the Intrinsic and Exxpetriminenstaicl StTudryaonf tshepInotrintsiPc arnodpExetrintsieic sTraonsfpoGrt rParopehrtietseofaGnradphiMte aundltMigurltiagrpaphenne SeamSpalesmples 1195 (a) (b) (c) (d) Fig. 2. Transmission Electron Microscopy pictures taken parallel to the graphene layers of two HOPG lamella. The c-axis is perpendicular to the clearly observable stripes of different gray colours, each representing a crystalline region with a slightly different orientation. The arrows in (a) and (b) indicate 400 nm length scale, in (c) 100 nm and in (d) 1 μm. Adapted from Barzola-Quiquia et al. (2008). is 60 ± 30 nm. One can clearly resolve the interfaces running perpendicular to the c-axis of the layers, parallel to the graphene layers. In Fig. 2(c) we also realize the end of crystalline regions along, normal or with a certain angle respect to the graphene layers direction. Other experimental technique used to characterize the crystal orientation, defects and grain boundaries is the electron backscattering diffraction (EBSD). The measurements were performed with a commercially available device (Ametek-TSL) included in our microscope. In this setup a cleaved bulk HOPG sample under investigation was illuminated by the SEM beam at an angle of 70◦ and the diffracted electrons were detected by a fluorescence screen and a digital camera. The included software was used to calculate the orientation of the crystalline regions within the HOPG surface as a function of the electron beam position. Figure 3 shows the grain distribution at the near surface region of a HOPG sample where the in-plane orientation is recognized by the (bluegreen) colour distribution. We recognize in this figure that the typical crystal size (on the (a,b) plane) in our HOPG samples is between a few μm and ∼ 20 μm. Taking into account the TEM pictures shown in Fig. 2 and the EBSD one in Fig. 3 we conclude that single crystalline regions in a HOPG good quality sample is not more than ∼ 20 μm long and less than ∼ 60 nm thick. If the interfaces between the crystalline regions as well as the defects in the crystalline structure in graphite have some influence on the transport properties we then expect to see a change in the behavior of the transport properties between samples of thickness of the order or less than the average thickness of the crystalline regions and of planar size below ∼ 10 μm.PDF Image | GRAPHENE SYNTHESIS CHARACTERIZATION PROPERTIES
PDF Search Title:
GRAPHENE SYNTHESIS CHARACTERIZATION PROPERTIESOriginal File Name Searched:
Graphene-Synthesis.pdfDIY PDF Search: Google It | Yahoo | Bing
Salgenx Redox Flow Battery Technology: Power up your energy storage game with Salgenx Salt Water Battery. With its advanced technology, the flow battery provides reliable, scalable, and sustainable energy storage for utility-scale projects. Upgrade to a Salgenx flow battery today and take control of your energy future.
| CONTACT TEL: 608-238-6001 Email: greg@infinityturbine.com | RSS | AMP |