PDF Publication Title:
Text from PDF Page: 006
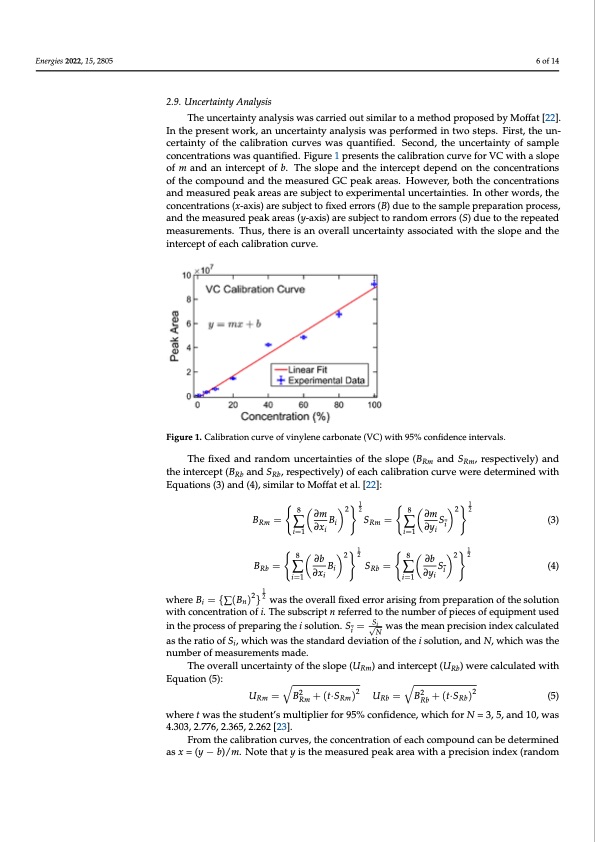
Energies 2022, 15, 2805 2.8. Analysis of Column Bleeding Aiming to determine whether the samples containing LiPF6 salt cause excessive col- umn bleeding, an experiment was carried out by injecting a blank acetone sample (con- sidered as the baseline sample) before and after five injections of COES and SBS #2. All Theuncceerrtatainintytyaannalaylysisiswwasacsacrarirerdieoduotusitmsimlariltaor atomaetmhoedthpordoporsoepdobseydMboyffMato[2ff2a]t. I[n22t]h.eInprtheseepnrtewseonrtkw, aonrku,nacnerutanicnetrytaaintaylyasnisalwysais pwearsfopremrfeodrminedtwino stwteops.teFpirss.tF,itrhset,uthne- cuenrctaeirntatyinotyfothfethcealcibalriabtriaotniocnucrvuervsewsawsaqsuqaunatnifitiefdie.d.SSeceoconndd,,ththeeuunncceerrttaaiinttyoffsample concentrattiions was quanttiifified.. Figure 1 presentts the calliibrattiion curve for VC wiith a slope ofmandaanninintetercreceppttofobf.bT.hTehsleopsleoapnedatnhdeitnhtericnetpertcdeepptednedpoendthoencotnhceecnotrnacteionntrsaotifotnhse ocfomthpeocuonmdpaonudntdheamndeatshuermedeGasCurpeedakGaCrepaes.aHkoawreeavse.rH,bowthevtheer,cboontchenthtreatcionsceantdramtieoans- aunrdedmpeaskuarerdeapseaarkesaurebajescatrteoseuxbpjercitmtoenetxapleurnimceerntatianltuiensc.eIrntaoitnhteiersw.oInrdost,htehrewconrdcesn,trhae- ctoionncsen(xtr-axtiiosn)sar(ex-sauxbisj)ecatretosufibxjedctetrorofirxse(dB)erdruoersto(Bt)hdeuseamtoptlheepsraempaprlaetpiorneparoactieosns,parnodcetshse, and the measured peak areas (y-axis) are subject to random errors (S) due to the repeated measured peak areas (y-axis) are subject to random errors (S) due to the repeated meas- chromatograms were inspected for any visual signs of column bleed, changes in peak shapes, or changes in retention times. 2..9.. Uncertainty Analysis intercept of each calibration curve. of each calibration curve. �� B= B� S= S�i (3) Rm ∑��i Rm ∑�� i=1 ∂xi � ��� � =�∑� ��� �� � i=1 ∂yi � ��� � =�∑� ��� �� � (4) �� ��� � 8 ���212 �� ��� �̅ 8 ���212 ∂b ∂b �B��= B S= S (4) where � = {∑(� ) }Rb� was∑the overai ll fixedRebrror ar∑ising fromi preparation of the solu- i=1 ∂xi i=1 ∂yi tion with concentration of i. The subscript n referred to the number of pieces of equipment used in the process of preparing the i solution. � = was the mean precision index cal- where B = {∑(B )2}2 was the overall fixed error arising from preparation of the solution 1 �� in �̅√� wcuitlhatceodnacsenthtreatriaotnioooffi.STi,hwehsiucbhswcraipstthneresftearnrdedartdodtheevinautimonbeorfothfepiescoelsuotifoenq,uainpdmNen,twuhsiecdh S was the number of measurements made. √ i in the process of preparing the i solution. Si = N was the mean precision index calculated as the ratio of Si, which was the standard deviation of the i solution, and N, which was the number of measurements made. The overall uncertainty of the slope (URm) and intercept (URb) were calculated with Equation (5): URm = BR2 m + (t·SRm)2 URb = BR2 b + (t·SRb)2 (5) where t was the student’s multiplier for 95% confidence, which for N = 3, 5, and 10, was 4.303, 2.776, 2.365, 2.262 [23]. From the calibration curves, the concentration of each compound can be determined as x = (y − b)/m. Note that y is the measured peak area with a precision index (random 6 of 14 measurements. Thus, there is an overall uncertainty associated with the slope and the urements. Thus, there is an overall uncertainty associated with the slope and the intercept Figure 1. Calibration curve of vinylene carbonate (VC) with 95% confidence intervals. Figure 1. Calibration curve of vinylene carbonate (VC) with 95% confidence intervals. The fifixed and random unccerrttaaiinttiieessooffththeeslsoloppee(B(BRm anadnSdRmS, re,sprescptievcetliyv)elayn)datnhde Rm Rm tihneteirncteprtce(BpRtb(aBndaSnRbd,rSesp,ercetsivpelcyt)ivoefleya)cohfcealcihbrcaatiloibnractuirovnecwurevredweeterermdienterdmwinitehdEwquitah- Rb Rb Etiqounast(io3)nasn(3d)(a4n),dsi(m4)i,lsairmtoilaMr otoffMatoeftfatl.e[t2a2l].:[22]: �� � 1�� �1�� �� �� 8�228�22 (3) � =�∑∂�m��� � =�∑∂�m��� �� ��� � �� ��� �̅PDF Image | Carbonate Solvent Systems Used in Lithium-Ion Batteries
PDF Search Title:
Carbonate Solvent Systems Used in Lithium-Ion BatteriesOriginal File Name Searched:
energies-15-02805.pdfDIY PDF Search: Google It | Yahoo | Bing
Product and Development Focus for Infinity Turbine
ORC Waste Heat Turbine and ORC System Build Plans: All turbine plans are $10,000 each. This allows you to build a system and then consider licensing for production after you have completed and tested a unit.Redox Flow Battery Technology: With the advent of the new USA tax credits for producing and selling batteries ($35/kW) we are focussing on a simple flow battery using shipping containers as the modular electrolyte storage units with tax credits up to $140,000 per system. Our main focus is on the salt battery. This battery can be used for both thermal and electrical storage applications. We call it the Cogeneration Battery or Cogen Battery. One project is converting salt (brine) based water conditioners to simultaneously produce power. In addition, there are many opportunities to extract Lithium from brine (salt lakes, groundwater, and producer water).Salt water or brine are huge sources for lithium. Most of the worlds lithium is acquired from a brine source. It's even in seawater in a low concentration. Brine is also a byproduct of huge powerplants, which can now use that as an electrolyte and a huge flow battery (which allows storage at the source).We welcome any business and equipment inquiries, as well as licensing our turbines for manufacturing.| CONTACT TEL: 608-238-6001 Email: greg@infinityturbine.com | RSS | AMP |