PDF Publication Title:
Text from PDF Page: 192
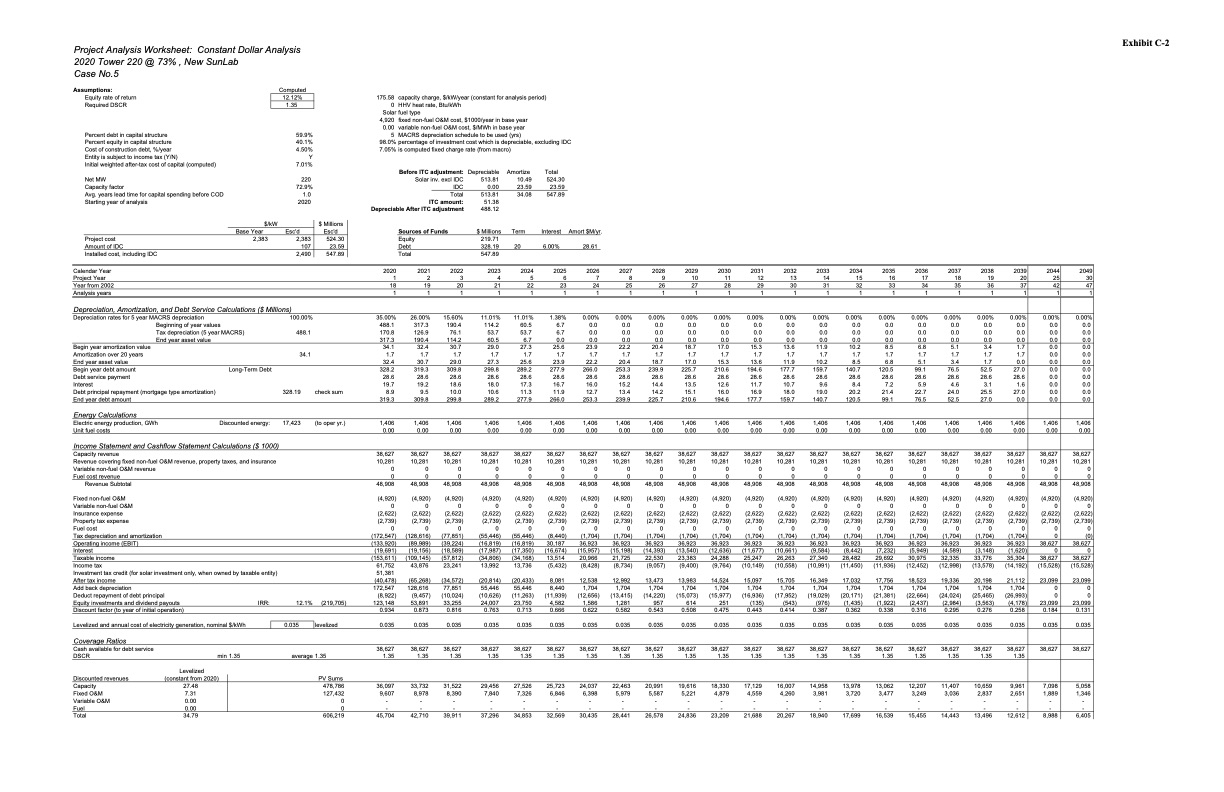
Project Analysis Worksheet: Constant Dollar Analysis 2020 Tower 220 @ 73% , New SunLab Case No.5 Exhibit C-2 Assumptions: Computed 12.12% 1.35 Equity rate of return Required DSCR 175.58 0 capacity charge, $/kW/year (constant for analysis period) HHV heat rate, Btu/kWh fuel type fixed non-fuel O&M cost, $1000/year in base year variable non-fuel O&M cost, $/MWh in base year MACRS depreciation schedule to be used (yrs) percentage of investment cost which is depreciable, Percent debt in capital structure Percent equity in capital structure Cost of construction debt, %/year Entity is subject to income tax (Y/N) Initial weighted after-tax cost of capital (computed) 59.9% 40.1% 4.50% Solar 4,920 0.00 5 Net MW Capacity factor Avg. years lead time for capital spending before COD Starting year of analysis 220 72.9% 1.0 Solar inv. excl IDC IDC Total ITC amount: Depreciable After ITC adjustment 23.59 547.89 Project cost Amount of IDC Installed cost, including IDC 2,383 524.30 23.59 547.89 Equity Debt Total Calendar Year Project Year Year from 2002 Analysis years 2020 1 18 1 2021 2 19 1 2022 3 20 1 2023 4 21 1 2024 5 22 1 2025 6 23 1 2026 2027 2028 2029 2030 2031 2032 2033 7 8 9 10 11 12 13 14 24 25 26 27 28 29 30 31 1 1 1 1 1 1 1 1 2034 2035 2036 2037 15 16 17 18 32 33 34 35 2038 2039 19 20 36 37 2044 2049 25 30 42 47 Depreciation, Amortization, and Debt Service Calculations ($ Millions) Depreciation rates for 5 year MACRS depreciation Beginning of year values 100.00% 488.1 35.00% 488.1 170.8 317.3 26.00% 317.3 126.9 190.4 15.60% 190.4 76.1 114.2 30.7 1.7 29.0 309.8 28.6 18.6 10.0 299.8 11.01% 114.2 53.7 60.5 29.0 1.7 27.3 299.8 28.6 18.0 10.6 289.2 11.01% 60.5 53.7 6.7 27.3 1.7 25.6 289.2 28.6 17.3 11.3 277.9 1.38% 6.7 6.7 0.0 25.6 1.7 23.9 277.9 28.6 16.7 11.9 266.0 0.00% 0.00% 0.00% 0.00% 0.00% 0.00% 0.00% 0.00% 0.0 0.0 0.0 0.0 0.0 0.0 0.0 0.0 0.0 0.0 0.0 0.0 0.0 0.0 0.0 0.0 0.0 0.0 0.0 0.0 0.0 0.0 0.0 0.0 0.00% 0.00% 0.00% 0.00% 0.0 0.0 0.0 0.0 0.0 0.0 0.0 0.0 0.0 0.0 0.0 0.0 0.00% 0.00% 0.0 0.0 0.0 0.0 0.0 0.0 3.4 1.7 1.7 1.7 1.7 0.0 0.00% 0.00% 0.0 0.0 0.0 0.0 0.0 0.0 0.0 0.0 0.0 0.0 0.0 0.0 0.0 0.0 0.0 0.0 0.0 0.0 0.0 0.0 0.0 0.0 Begin year amortization value Amortization over 20 years End year asset value Begin year debt amount 34.1 34.1 1.7 32.4 328.2 28.6 19.7 8.9 319.3 32.4 1.7 30.7 319.3 28.6 19.2 9.5 309.8 23.9 22.2 20.4 18.7 17.0 15.3 13.6 11.9 1.7 1.7 1.7 1.7 1.7 1.7 1.7 1.7 22.2 20.4 18.7 17.0 15.3 13.6 11.9 10.2 266.0 253.3 239.9 225.7 210.6 194.6 177.7 159.7 28.6 28.6 28.6 28.6 28.6 28.6 28.6 28.6 16.0 15.2 14.4 13.5 12.6 11.7 10.7 9.6 12.7 13.4 14.2 15.1 16.0 16.9 18.0 19.0 253.3 239.9 225.7 210.6 194.6 177.7 159.7 140.7 10.2 8.5 6.8 5.1 1.7 1.7 1.7 1.7 8.5 6.8 5.1 3.4 Debt service payment Interest Debt principal repayment (mortgage type amortization) End year debt amount 328.19 check sum Energy Calculations Electric energy production, GWh Unit fuel costs Discounted energy: 17,423 (to oper yr.) 1,406 0.00 1,406 0.00 1,406 0.00 1,406 0.00 1,406 0.00 1,406 0.00 1,406 1,406 1,406 1,406 1,406 1,406 1,406 1,406 0.00 0.00 0.00 0.00 0.00 0.00 0.00 0.00 1,406 1,406 1,406 1,406 0.00 0.00 0.00 0.00 1,406 1,406 0.00 0.00 1,406 1,406 0.00 0.00 Tax depreciation (5 year MACRS) End year asset value Income Statement and Cashflow Statement Calculations ($ 1000) Capacity revenue Revenue covering fixed non-fuel O&M revenue, property taxes, and insurance Variable non-fuel O&M revenue Fuel cost revenue 38,627 10,281 0 0 48,908 38,627 10,281 0 0 48,908 38,627 10,281 0 0 48,908 38,627 10,281 0 0 48,908 38,627 10,281 0 0 48,908 38,627 10,281 0 0 48,908 38,627 38,627 38,627 38,627 38,627 38,627 38,627 38,627 10,281 10,281 10,281 10,281 10,281 10,281 10,281 10,281 0 0 0 0 0 0 0 0 0 0 0 0 0 0 0 0 48,908 48,908 48,908 48,908 48,908 48,908 48,908 48,908 38,627 38,627 38,627 38,627 10,281 10,281 10,281 10,281 0 0 0 0 0 0 0 0 48,908 48,908 48,908 48,908 38,627 38,627 10,281 10,281 0 0 0 0 48,908 48,908 38,627 38,627 10,281 10,281 0 0 0 0 48,908 48,908 Revenue Subtotal Fixed non-fuel O&M Variable non-fuel O&M Insurance expense Property tax expense Fuel cost (4,920) (4,920) (4,920) (4,920) (4,920) (4,920) (4,920) (4,920) (4,920) (4,920) (4,920) (4,920) (4,920) (4,920) (4,920) (4,920) (4,920) (4,920) (4,920) (4,920) (4,920) Tax depreciation and amortization Operating income (EBIT) Interest Taxable income (172,547) (133,920) (19,691) (153,611) (128,616) (89,989) (19,156) (77,851) (39,224) (18,589) (57,812) 23,241 (55,446) (16,819) (17,987) (34,806) 13,992 (55,446) (16,819) (17,350) (34,168) 13,736 (8,440) 30,187 (16,674) 13,514 (1,704) 36,923 (15,957) 20,966 (1,704) 36,923 (15,198) 21,725 (1,704) 36,923 (14,393) 22,530 (1,704) 36,923 (13,540) 23,383 (1,704) 36,923 (12,636) 24,288 (1,704) 36,923 (11,677) 25,247 (10,149) (1,704) 36,923 (10,661) 26,263 (10,558) (1,704) 36,923 (9,584) 27,340 (10,991) (1,704) 36,923 (8,442) 28,482 (11,450) (1,704) 36,923 (7,232) 29,692 (11,936) (1,704) 36,923 (5,949) 30,975 (12,452) (1,704) 36,923 (4,589) 32,335 (12,998) (1,704) 36,923 (3,148) 33,776 (13,578) (1,704) 36,923 (1,620) 35,304 (14,192) 0 38,627 0 38,627 38,627 0 38,627 Income tax Investment tax credit (for solar investment only, when owned by taxable entity) After tax income Add back depreciation Deduct repayment of debt principal Equity investments and dividend payouts Discount factor (to year of initial operation) 61,752 (109,145) 43,876 (5,432) (8,428) (8,734) (9,057) (9,400) (9,764) (15,528) (15,528) Levelized and annual cost of electricity generation, nominal $/kWh 0.035 0.035 0.816 0.035 0.763 0.035 0.713 0.035 0.666 0.035 0.035 0.035 0.035 0.035 0.035 0.035 0.035 0.035 0.035 0.035 0.035 0.035 0.035 0.035 0.035 38,627 0.035 38,627 Coverage Ratios Cash available for debt service DSCR min 1.35 average 1.35 38,627 1.35 38,627 1.35 38,627 1.35 38,627 1.35 38,627 1.35 38,627 1.35 38,627 1.35 38,627 1.35 38,627 1.35 38,627 1.35 38,627 1.35 38,627 1.35 38,627 1.35 38,627 1.35 38,627 1.35 38,627 1.35 38,627 1.35 38,627 1.35 38,627 1.35 38,627 1.35 Discounted revenues Capacity Fixed O&M Variable O&M Levelized (constant from 2020) 27.48 PV Sums 478,786 127,432 36,097 9,607 33,732 8,978 31,522 8,390 29,456 7,840 27,526 7,326 25,723 6,846 24,037 6,398 22,463 5,979 20,991 5,587 19,616 5,221 18,330 4,879 17,129 4,559 16,007 4,260 14,958 3,981 13,978 3,720 13,062 3,477 12,207 3,249 11,407 3,036 10,659 2,837 9,961 7,098 5,058 $/kW Base Year Esc'd 2,383 $ Millions Esc'd Sources of Funds $ Millions 219.71 328.19 547.89 Term 20 Interest 6.00% Amort $M/yr. 28.61 Long-Term Debt 140.7 120.5 99.1 76.5 28.6 28.6 28.6 28.6 8.4 7.2 5.9 4.6 20.2 21.4 22.7 24.0 120.5 99.1 76.5 52.5 52.5 27.0 28.6 28.6 3.1 1.6 25.5 27.0 27.0 0.0 IRR: 12.1% 0.035 (219,705) levelized 123,148 0.934 8,440 (11,939) 4,582 957 0.543 614 0.508 251 0.475 (135) 0.443 (543) 0.414 (976) 0.387 Y 7.01% 2020 107 2,490 98.0% 7.05% excluding IDC 51,381 (40,478) 172,547 (8,922) (65,268) 128,616 (9,457) 53,891 0.873 (34,572) 77,851 (10,024) 33,255 (20,814) 55,446 (10,626) 24,007 (20,433) 55,446 (11,263) 23,750 8,081 12,538 1,704 (12,656) 1,586 0.622 12,992 1,704 (13,415) 1,281 0.582 13,473 1,704 (14,220) 13,983 1,704 (15,073) 14,524 1,704 (15,977) 15,097 1,704 (16,936) 15,705 1,704 (17,952) 16,349 1,704 (19,029) 17,032 1,704 (20,171) (1,435) 0.362 17,756 1,704 (21,381) (1,922) 0.338 18,523 1,704 (22,664) (2,437) 0.316 19,336 1,704 (24,024) (2,984) 0.295 20,198 1,704 (25,465) (3,563) 0.276 21,112 1,704 (26,993) (4,178) 0.258 23,099 0 0 23,099 0.184 23,099 0 0 23,099 0.131 is computed fixed charge rate (from macro) Before ITC adjustment: Depreciable 513.81 0.00 513.81 51.38 488.12 Amortize 10.49 23.59 34.08 Total 524.30 (4,920) 0 0 0 0 0 0 0 0 0 0 0 0 0 0 0 0 0 0 0 0 0 0 (2,622) (2,622) (2,622) (2,622) (2,622) (2,622) (2,622) (2,622) (2,622) (2,622) (2,622) (2,622) (2,622) (2,622) (2,622) (2,622) (2,622) (2,622) (2,622) (2,622) (2,622) (2,739) (2,739) (2,739) (2,739) (2,739) (2,739) (2,739) (2,739) (2,739) (2,739) (2,739) (2,739) (2,739) (2,739) (2,739) (2,739) (2,739) (2,739) (2,739) (2,739) (2,739) (2,622) (2,739) 000000000000000000000 0 (0) 2,651 - - - - - - - - - - - - - - - - - - - - - - Fuel 0.00 0---------------------- 1,889 Total 34.79 606,219 45,704 42,710 39,911 37,296 34,853 32,569 30,435 28,441 26,578 24,836 23,209 21,688 20,267 18,940 17,699 16,539 15,455 14,443 13,496 12,612 8,988 6,405 7.31 0.00 1,346 0 1 1 1 1 1 1 1 1PDF Image | Assessment of Parabolic Trough and Power Tower Solar Technology Cost and Performance Forecasts
PDF Search Title:
Assessment of Parabolic Trough and Power Tower Solar Technology Cost and Performance ForecastsOriginal File Name Searched:
34440.pdfDIY PDF Search: Google It | Yahoo | Bing
NFT (Non Fungible Token): Buy our tech, design, development or system NFT and become part of our tech NFT network... More Info
IT XR Project Redstone NFT Available for Sale: NFT for high tech turbine design with one part 3D printed counter-rotating energy turbine. Be part of the future with this NFT. Can be bought and sold but only one design NFT exists. Royalties go to the developer (Infinity) to keep enhancing design and applications... More Info
Infinity Turbine IT XR Project Redstone Design: NFT for sale... NFT for high tech turbine design with one part 3D printed counter-rotating energy turbine. Includes all rights to this turbine design, including license for Fluid Handling Block I and II for the turbine assembly and housing. The NFT includes the blueprints (cad/cam), revenue streams, and all future development of the IT XR Project Redstone... More Info
Infinity Turbine ROT Radial Outflow Turbine 24 Design and Worldwide Rights: NFT for sale... NFT for the ROT 24 energy turbine. Be part of the future with this NFT. This design can be bought and sold but only one design NFT exists. You may manufacture the unit, or get the revenues from its sale from Infinity Turbine. Royalties go to the developer (Infinity) to keep enhancing design and applications... More Info
Infinity Supercritical CO2 10 Liter Extractor Design and Worldwide Rights: The Infinity Supercritical 10L CO2 extractor is for botanical oil extraction, which is rich in terpenes and can produce shelf ready full spectrum oil. With over 5 years of development, this industry leader mature extractor machine has been sold since 2015 and is part of many profitable businesses. The process can also be used for electrowinning, e-waste recycling, and lithium battery recycling, gold mining electronic wastes, precious metals. CO2 can also be used in a reverse fuel cell with nafion to make a gas-to-liquids fuel, such as methanol, ethanol and butanol or ethylene. Supercritical CO2 has also been used for treating nafion to make it more effective catalyst. This NFT is for the purchase of worldwide rights which includes the design. More Info
NFT (Non Fungible Token): Buy our tech, design, development or system NFT and become part of our tech NFT network... More Info
Infinity Turbine Products: Special for this month, any plans are $10,000 for complete Cad/Cam blueprints. License is for one build. Try before you buy a production license. May pay by Bitcoin or other Crypto. Products Page... More Info
| CONTACT TEL: 608-238-6001 Email: greg@infinityturbine.com | RSS | AMP |