PDF Publication Title:
Text from PDF Page: 191
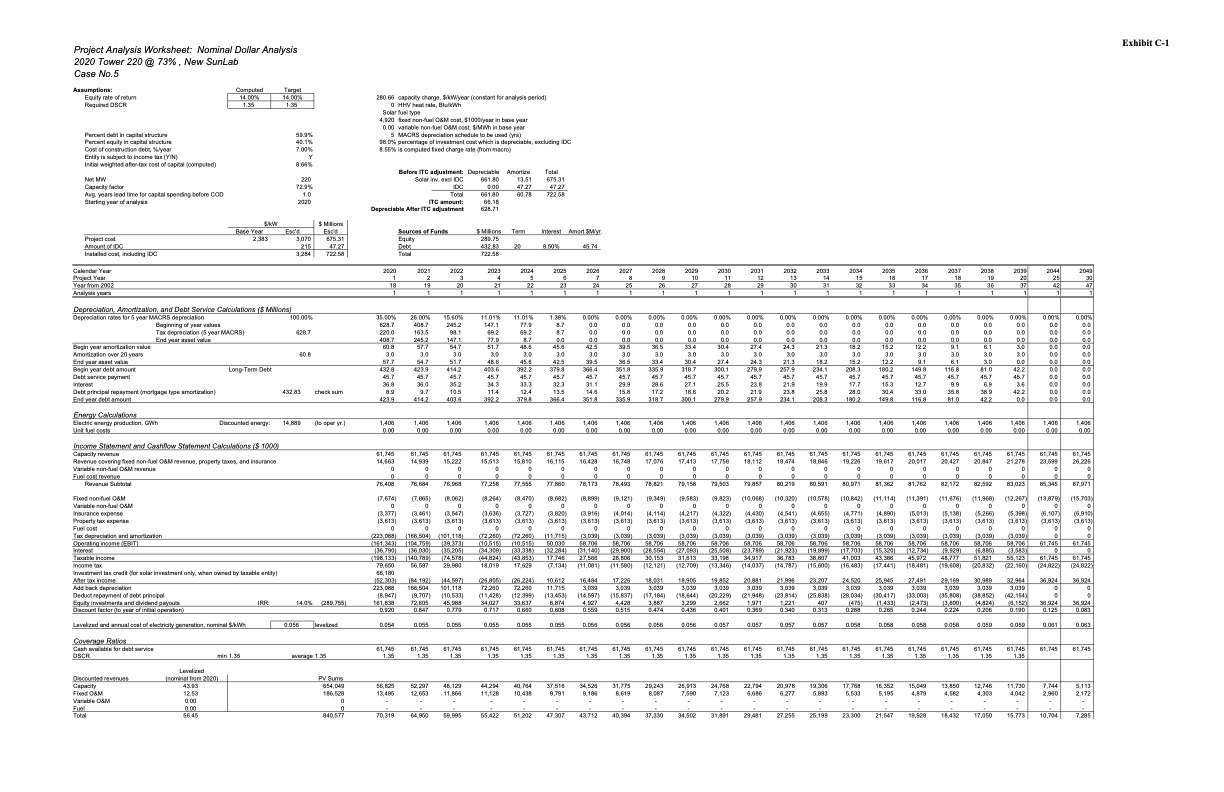
Project Analysis Worksheet: Nominal Dollar Analysis 2020 Tower 220 @ 73% , New SunLab Case No.5 Exhibit C-1 Assumptions: Computed 14.00% 1.35 Target 14.00% 1.35 Equity rate of return Required DSCR 280.66 0 capacity charge, $/kW/year (constant for analysis period) HHV heat rate, Btu/kWh fuel type fixed non-fuel O&M cost, $1000/year in base year variable non-fuel O&M cost, $/MWh in base year MACRS depreciation schedule to be used (yrs) percentage of investment cost which is depreciable, Percent debt in capital structure Percent equity in capital structure Cost of construction debt, %/year Entity is subject to income tax (Y/N) Initial weighted after-tax cost of capital (computed) 59.9% 40.1% 7.00% Solar 4,920 0.00 5 Net MW Capacity factor Avg. years lead time for capital spending before COD Starting year of analysis 220 72.9% 1.0 Solar inv. excl IDC IDC Total ITC amount: Depreciable After ITC adjustment 47.27 722.58 Project cost Amount of IDC Installed cost, including IDC 2,383 675.31 47.27 722.58 Equity Debt Total Calendar Year Project Year Year from 2002 Analysis years 2020 1 18 1 2021 2 19 1 2022 3 20 1 2023 4 21 1 2024 5 22 1 2025 6 23 1 2026 2027 2028 2029 7 8 9 10 24 25 26 27 1 1 1 1 2030 2031 11 12 28 29 2032 2033 13 14 30 31 2034 2035 15 16 32 33 2036 2037 17 18 34 35 2038 2039 19 20 36 37 2044 2049 25 30 42 47 Depreciation, Amortization, and Debt Service Calculations ($ Millions) Depreciation rates for 5 year MACRS depreciation Beginning of year values 100.00% 628.7 35.00% 628.7 220.0 408.7 26.00% 408.7 163.5 245.2 15.60% 245.2 98.1 147.1 54.7 3.0 51.7 414.2 45.7 35.2 10.5 403.6 11.01% 147.1 69.2 77.9 51.7 3.0 48.6 403.6 45.7 34.3 11.4 392.2 11.01% 77.9 69.2 8.7 48.6 3.0 45.6 392.2 45.7 33.3 12.4 379.8 1.38% 8.7 8.7 0.0 45.6 3.0 42.5 379.8 45.7 32.3 13.5 366.4 0.00% 0.00% 0.00% 0.00% 0.0 0.0 0.0 0.0 0.0 0.0 0.0 0.0 0.0 0.0 0.0 0.0 0.00% 0.00% 0.0 0.0 0.0 0.0 0.0 0.0 0.00% 0.00% 0.0 0.0 0.0 0.0 0.0 0.0 0.00% 0.00% 0.0 0.0 0.0 0.0 0.0 0.0 0.00% 0.00% 0.0 0.0 0.0 0.0 0.0 0.0 0.00% 0.00% 0.0 0.0 0.0 0.0 0.0 0.0 6.1 3.0 3.0 3.0 3.0 0.0 0.00% 0.00% 0.0 0.0 0.0 0.0 0.0 0.0 0.0 0.0 0.0 0.0 0.0 0.0 0.0 0.0 0.0 0.0 0.0 0.0 0.0 0.0 0.0 0.0 Begin year amortization value Amortization over 20 years End year asset value Begin year debt amount 60.8 60.8 3.0 57.7 432.8 45.7 36.8 8.9 423.9 57.7 3.0 54.7 423.9 45.7 36.0 9.7 414.2 42.5 39.5 36.5 33.4 3.0 3.0 3.0 3.0 39.5 36.5 33.4 30.4 366.4 351.8 335.9 318.7 45.7 45.7 45.7 45.7 31.1 29.9 28.6 27.1 14.6 15.8 17.2 18.6 351.8 335.9 318.7 300.1 30.4 27.4 3.0 3.0 27.4 24.3 300.1 279.9 45.7 45.7 25.5 23.8 20.2 21.9 279.9 257.9 24.3 21.3 3.0 3.0 21.3 18.2 257.9 234.1 45.7 45.7 21.9 19.9 23.8 25.8 234.1 208.3 18.2 15.2 3.0 3.0 15.2 12.2 208.3 180.2 45.7 45.7 17.7 15.3 28.0 30.4 180.2 149.8 12.2 9.1 3.0 3.0 9.1 6.1 Debt service payment Interest Debt principal repayment (mortgage type amortization) End year debt amount 432.83 check sum Energy Calculations Electric energy production, GWh Unit fuel costs Discounted energy: 14,889 (to oper yr.) 1,406 0.00 1,406 0.00 1,406 0.00 1,406 0.00 1,406 0.00 1,406 0.00 1,406 1,406 1,406 1,406 0.00 0.00 0.00 0.00 1,406 1,406 0.00 0.00 1,406 1,406 0.00 0.00 1,406 1,406 0.00 0.00 1,406 1,406 0.00 0.00 1,406 1,406 0.00 0.00 1,406 1,406 0.00 0.00 Tax depreciation (5 year MACRS) End year asset value Income Statement and Cashflow Statement Calculations ($ 1000) Capacity revenue Revenue covering fixed non-fuel O&M revenue, property taxes, and insurance Variable non-fuel O&M revenue Fuel cost revenue 61,745 14,663 0 0 76,408 61,745 14,939 0 0 76,684 61,745 15,222 0 0 76,968 61,745 15,513 0 0 77,258 61,745 15,810 0 0 77,555 61,745 16,115 0 0 77,860 61,745 61,745 61,745 61,745 16,428 16,748 17,076 17,413 0 0 0 0 0 0 0 0 78,173 78,493 78,821 79,158 61,745 61,745 17,758 18,112 0 0 0 0 79,503 79,857 61,745 61,745 18,474 18,846 0 0 0 0 80,219 80,591 61,745 61,745 19,226 19,617 0 0 0 0 80,971 81,362 61,745 61,745 20,017 20,427 0 0 0 0 81,762 82,172 61,745 61,745 20,847 21,278 0 0 0 0 82,592 83,023 61,745 61,745 23,599 26,226 0 0 0 0 85,345 87,971 Revenue Subtotal Fixed non-fuel O&M Variable non-fuel O&M Insurance expense Property tax expense Fuel cost (7,674) (7,865) (8,062) (8,470) (8,682) (8,899) (9,121) (9,349) (9,583) (9,823) (10,068) (10,320) (10,578) (10,842) (11,114) (11,391) (11,676) (11,968) (12,267) (13,879) (15,703) Tax depreciation and amortization Operating income (EBIT) Interest Taxable income (223,088) (161,343) (36,790) (198,133) (166,504) (104,759) (36,030) (140,789) (101,118) (39,373) (35,205) (74,578) 29,980 (72,260) (10,515) (34,309) (44,824) 18,019 (72,260) (10,515) (33,338) (43,853) 17,629 (11,715) 50,030 (32,284) 17,746 (3,039) 58,706 (31,140) 27,566 (11,081) (3,039) 58,706 (29,900) 28,806 (11,580) (3,039) 58,706 (28,554) 30,153 (12,121) (3,039) 58,706 (27,093) 31,613 (12,709) (3,039) 58,706 (25,508) 33,198 (13,346) (3,039) 58,706 (23,789) 34,917 (14,037) (3,039) 58,706 (21,923) 36,783 (14,787) (3,039) 58,706 (19,899) 38,807 (15,600) (3,039) 58,706 (17,703) 41,003 (16,483) (3,039) 58,706 (15,320) 43,386 (17,441) (3,039) 58,706 (12,734) 45,972 (18,481) (3,039) 58,706 (9,929) 48,777 (19,608) (3,039) 58,706 (6,885) 51,821 (20,832) (3,039) 58,706 (3,583) 55,123 (22,160) 0 61,745 0 61,745 0 61,745 0 61,745 Income tax Investment tax credit (for solar investment only, when owned by taxable entity) After tax income Add back depreciation Deduct repayment of debt principal Equity investments and dividend payouts Discount factor (to year of initial operation) 79,650 56,597 (7,134) (24,822) (24,822) Levelized and annual cost of electricity generation, nominal $/kWh 0.054 0.055 0.055 0.717 0.055 0.660 0.055 0.608 0.055 0.056 0.056 0.056 0.056 0.057 0.057 0.057 0.057 0.058 0.058 0.058 0.058 0.059 0.059 0.061 61,745 0.063 61,745 Coverage Ratios Cash available for debt service DSCR min 1.35 average 1.35 61,745 1.35 61,745 1.35 61,745 1.35 61,745 1.35 61,745 1.35 61,745 1.35 61,745 1.35 61,745 1.35 61,745 1.35 61,745 1.35 61,745 1.35 61,745 1.35 61,745 1.35 61,745 1.35 61,745 1.35 61,745 1.35 61,745 1.35 61,745 1.35 61,745 1.35 61,745 1.35 Discounted revenues Capacity Fixed O&M Variable O&M Levelized (nominal from 2020) 43.93 PV Sums 654,049 186,528 56,825 13,495 52,297 48,129 44,294 40,764 37,516 9,791 34,526 9,186 31,775 8,619 29,243 8,087 26,913 7,590 24,768 7,123 22,794 6,686 20,978 6,277 19,306 5,893 17,768 5,533 16,352 5,195 15,049 4,879 13,850 4,582 12,746 4,303 11,730 4,042 7,744 5,113 $/kW Base Year Esc'd 3,070 $ Millions Esc'd Sources of Funds $ Millions 289.75 432.83 722.58 Term 20 Interest 8.50% Amort $M/yr. 45.74 Long-Term Debt 149.8 116.8 45.7 45.7 12.7 9.9 33.0 35.8 81.0 42.2 45.7 45.7 6.9 3.6 38.9 42.2 42.2 0.0 IRR: 14.0% 0.056 (289,755) levelized 161,838 0.920 11,715 (13,453) 8,874 407 0.313 (475) 0.288 Y 8.66% 2020 215 3,284 98.0% 8.55% excluding IDC 66,180 (52,303) 223,088 (8,947) (84,192) 166,504 (9,707) 72,605 0.847 (44,597) 101,118 (10,533) 45,988 0.779 (26,805) 72,260 (11,428) 34,027 (26,224) 72,260 (12,399) 33,637 10,612 16,484 3,039 (14,597) 4,927 0.559 17,226 3,039 (15,837) 4,428 0.515 18,031 3,039 (17,184) 3,887 0.474 18,905 3,039 (18,644) 3,299 0.436 19,852 3,039 (20,229) 2,662 0.401 20,881 3,039 (21,948) 1,971 0.369 21,996 3,039 (23,814) 1,221 0.340 23,207 3,039 (25,838) 24,520 3,039 (28,034) 25,945 3,039 (30,417) (1,433) 0.265 27,491 3,039 (33,003) (2,473) 0.244 29,169 3,039 (35,808) (3,600) 0.224 30,989 3,039 (38,852) (4,824) 0.206 32,964 3,039 (42,154) (6,152) 0.190 36,924 0 0 36,924 0.125 36,924 0 0 36,924 0.083 is computed fixed charge rate (from macro) Before ITC adjustment: Depreciable 661.80 0.00 661.80 66.18 628.71 Amortize 13.51 47.27 60.78 Total 675.31 1 1 1 1 1 1 1 1 1 1 1 1 (8,264) 0 0 0 0 0 0 0 0 0 0 0 0 0 0 0 0 0 0 0 0 0 0 (3,377) (3,461) (3,547) (3,636) (3,727) (3,820) (3,916) (4,014) (4,114) (4,217) (4,322) (4,430) (4,541) (4,655) (4,771) (4,890) (5,013) (5,138) (5,266) (5,398) (6,107) (3,613) (3,613) (3,613) (3,613) (3,613) (3,613) (3,613) (3,613) (3,613) (3,613) (3,613) (3,613) (3,613) (3,613) (3,613) (3,613) (3,613) (3,613) (3,613) (3,613) (3,613) (6,910) (3,613) 000000000000000000000 0 2,960 - - - - - - - - - - - - - - - - - - - - - - Fuel 0.00 0---------------------- 2,172 Total 56.45 840,577 70,319 64,950 59,995 55,422 51,202 47,307 43,712 40,394 37,330 34,502 31,891 29,481 27,255 25,199 23,300 21,547 19,928 18,432 17,050 15,773 10,704 7,285 12.53 0.00 12,653 11,866 11,128 10,438 0 116.8 81.0PDF Image | Assessment of Parabolic Trough and Power Tower Solar Technology Cost and Performance Forecasts
PDF Search Title:
Assessment of Parabolic Trough and Power Tower Solar Technology Cost and Performance ForecastsOriginal File Name Searched:
34440.pdfDIY PDF Search: Google It | Yahoo | Bing
NFT (Non Fungible Token): Buy our tech, design, development or system NFT and become part of our tech NFT network... More Info
IT XR Project Redstone NFT Available for Sale: NFT for high tech turbine design with one part 3D printed counter-rotating energy turbine. Be part of the future with this NFT. Can be bought and sold but only one design NFT exists. Royalties go to the developer (Infinity) to keep enhancing design and applications... More Info
Infinity Turbine IT XR Project Redstone Design: NFT for sale... NFT for high tech turbine design with one part 3D printed counter-rotating energy turbine. Includes all rights to this turbine design, including license for Fluid Handling Block I and II for the turbine assembly and housing. The NFT includes the blueprints (cad/cam), revenue streams, and all future development of the IT XR Project Redstone... More Info
Infinity Turbine ROT Radial Outflow Turbine 24 Design and Worldwide Rights: NFT for sale... NFT for the ROT 24 energy turbine. Be part of the future with this NFT. This design can be bought and sold but only one design NFT exists. You may manufacture the unit, or get the revenues from its sale from Infinity Turbine. Royalties go to the developer (Infinity) to keep enhancing design and applications... More Info
Infinity Supercritical CO2 10 Liter Extractor Design and Worldwide Rights: The Infinity Supercritical 10L CO2 extractor is for botanical oil extraction, which is rich in terpenes and can produce shelf ready full spectrum oil. With over 5 years of development, this industry leader mature extractor machine has been sold since 2015 and is part of many profitable businesses. The process can also be used for electrowinning, e-waste recycling, and lithium battery recycling, gold mining electronic wastes, precious metals. CO2 can also be used in a reverse fuel cell with nafion to make a gas-to-liquids fuel, such as methanol, ethanol and butanol or ethylene. Supercritical CO2 has also been used for treating nafion to make it more effective catalyst. This NFT is for the purchase of worldwide rights which includes the design. More Info
NFT (Non Fungible Token): Buy our tech, design, development or system NFT and become part of our tech NFT network... More Info
Infinity Turbine Products: Special for this month, any plans are $10,000 for complete Cad/Cam blueprints. License is for one build. Try before you buy a production license. May pay by Bitcoin or other Crypto. Products Page... More Info
| CONTACT TEL: 608-238-6001 Email: greg@infinityturbine.com | RSS | AMP |