PDF Publication Title:
Text from PDF Page: 015
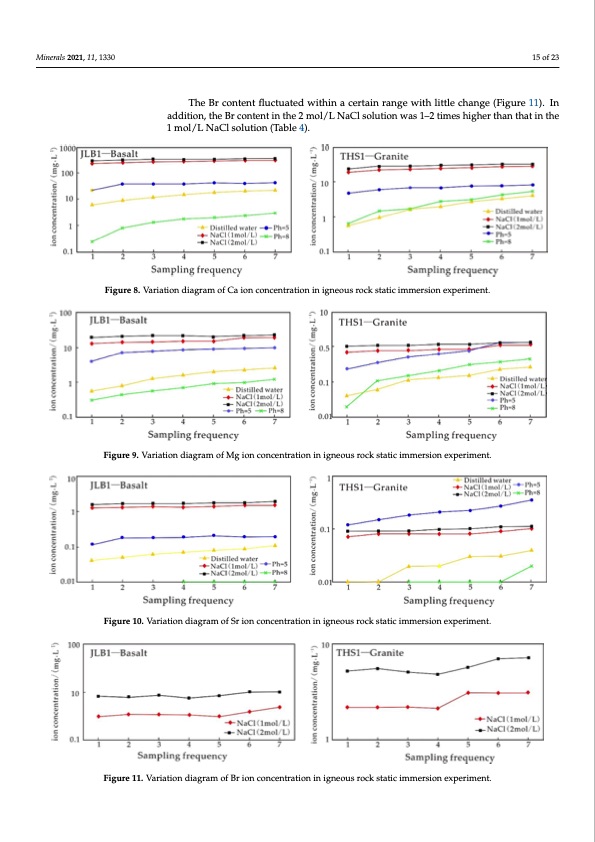
mol/L and 2 mol/L NaCl solutions, followed by the solution with pH = 5; the lowest el- Minerals 2021, 11, 1330 ally higher than those in 1 mol/L NaCl solution. In the 1 mol/L NaCl solution, the max- ement content was in the distilled water and the solution with pH = 8 (Figures 8–10), in ement content was in the distilled water and the solution with pH = 8 (Figures 8–10), in which the content of Ca was the highest, followed by Mg, and the lowest was Sr. With which the content of Ca was the highest, followed by Mg, and the lowest was Sr. With increasing soaking time, the dissolution amount of the three kinds of ions increased increasing soaking time, the dissolution amount of the three kinds of ions increased slowly. At room temperature, the Ca, Mg, and Sr contents in 2 mol/L NaCl were gener- slowly. At room temperature, the Ca, Mg, and Sr contents in 2 mol/L NaCl were gener- ally higher than those in 1 mol/L NaCl solution. In the 1 mol/L NaCl solution, the max- imum Ca dissolution amount was 290.40 mg/L, and the concentration of Ca increased imum Ca dissolution amount was 290.40 mg/L, and the concentration of Ca increased with increasing salinity and immersion time. The maximum value of Ca in the 2 mol/L with increasing salinity and immersion time. The maximum value of Ca in the 2 mol/L NaCl solution was 343.45 mg/L. In the 1 mol/L NaCl solution, the maximum Mg disso- NaCl solution was 343.45 mg/L. In the 1 mol/L NaCl solution, the maximum Mg disso- lutiTonhewBasr 1c8o.n97temntg/flLu,cwtuhailteeidnwthieth2inmoal/cLerNtaiCnlrsaonlugteiown,ithelimttalexicmhuamngMe g(Fdigisusorelu1ti1o)n. In lution was 18.97 mg/L, while in the 2 mol/L NaCl solution, the maximum Mg dissolution adwdaistio22n.,7t9hMe Bgr/Lc.oInte1nmtoinl/LthNea2Cml sool/luLtiNona,Cthl esomluatxioimnuwmasS1r–r2elteiamseswhaisgh1.e5r9tmhagn/Lth, wathiinlethe was 22.79 Mg/L. In 1mol/L NaCl solution, the maximum Sr release was 1.59 mg/L, while 1 imnothl/eL2NmaoCl/lLsNolauCtilosnol(uTtaiobnle, t4h)e. maximum Sr release was 1.90 mg/L (Table 4). in the 2 mol/L NaCl solution, the maximum Sr release was 1.90 mg/L (Table 4). 15 of 23 Figure 8. Variation diagram of Ca ion concentration in igneous rock static immersion experiment. Figure 8. Variation diagram of Ca ion concentration in igneous rock static immersion experiment. Figure 8. Variation diagram of Ca ion concentration in igneous rock static immersion experiment. Minerals 2021, 11, 1330 Minerals 2021, 11, 1330 16 of 24 16 of 24 Figure 9. Variation diagram of Mg ion concentration in igneous rock static immersion experiment. Figure 9. Variation diagram of Mg ion concentration in igneous rock static immersion experiment. Figure 9. Variation diagram of Mg ion concentration in igneous rock static immersion experiment. Figure 10. Variation diagram of Sr ion concentration in igneous rock static immersion experiment. No concentration of lithium was detected in the five fluids. Br, I, and B were not detected in distilled water, pH = 5, and pH = 8 solutions but were detected in the 1 mol/L and 2 mol/L NaCl solutions. The changes in Br, I, and B in 1 mol/L and 2 mol/L NaCl solutions are discussed as follows: The Br content fluctuated within a certain range with little change (Figure 11). In addition, the Br content in the 2 mol/L NaCl solution was 1–2 times higher than that in Figure 10. Variation diagram of Sr ion concentration in igneous rock static immersion experiment. Figure 10. Variation diagram of Sr ion concentration in igneous rock static immersion experiment. the 1 mol/L NaCl solution (Table 4). No concentration of lithium was detected in the five fluids. Br, I, and B were not detected in distilled water, pH = 5, and pH = 8 solutions but were detected in the 1 mol/L and 2 mol/L NaCl solutions. The changes in Br, I, and B in 1 mol/L and 2 mol/L NaCl solutions are discussed as follows: The Br content fluctuated within a certain range with little change (Figure 11). In addition, the Br content in the 2 mol/L NaCl solution was 1–2 times higher than that in the 1 mol/L NaCl solution (Table 4). Figure 11. Variation diagram of Br ion concentration in igneous rock static immersion experiment. Figure 11. Variation diagram of Br ion concentration in igneous rock static immersion experiment. The I and B contents in the solution were low with little fluctuation, but the saline fluid more easily activated the ions (Figures 12 and 13). Moreover, the activation effect of the 2 mol/L NaCl solution was better than that of the 1 mol/L NaCl solution; it was gen- erally 1~2 times higher (Table 4).PDF Image | Origin of Lithium Potassium Rich Brines in the Jianghan
PDF Search Title:
Origin of Lithium Potassium Rich Brines in the JianghanOriginal File Name Searched:
minerals-11-01330-v2.pdfDIY PDF Search: Google It | Yahoo | Bing
Product and Development Focus for Infinity Turbine
ORC Waste Heat Turbine and ORC System Build Plans: All turbine plans are $10,000 each. This allows you to build a system and then consider licensing for production after you have completed and tested a unit.Redox Flow Battery Technology: With the advent of the new USA tax credits for producing and selling batteries ($35/kW) we are focussing on a simple flow battery using shipping containers as the modular electrolyte storage units with tax credits up to $140,000 per system. Our main focus is on the salt battery. This battery can be used for both thermal and electrical storage applications. We call it the Cogeneration Battery or Cogen Battery. One project is converting salt (brine) based water conditioners to simultaneously produce power. In addition, there are many opportunities to extract Lithium from brine (salt lakes, groundwater, and producer water).Salt water or brine are huge sources for lithium. Most of the worlds lithium is acquired from a brine source. It's even in seawater in a low concentration. Brine is also a byproduct of huge powerplants, which can now use that as an electrolyte and a huge flow battery (which allows storage at the source).We welcome any business and equipment inquiries, as well as licensing our turbines for manufacturing.| CONTACT TEL: 608-238-6001 Email: greg@infinityturbine.com | RSS | AMP |