PDF Publication Title:
Text from PDF Page: 007
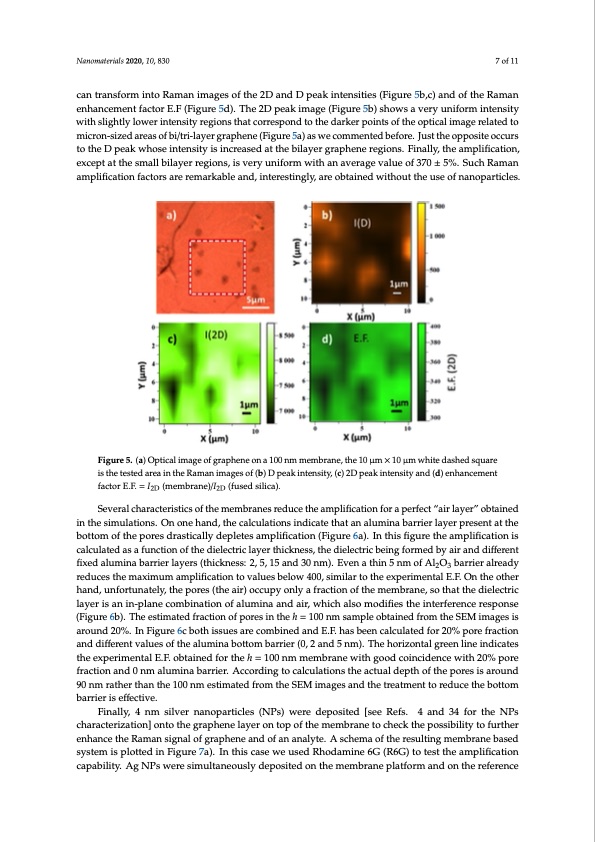
4.5 min is E.F. ≈ 265 and for h = 100 nm membrane, higher values are obtained with average value E.F. ≈ 370. One important point is to evaluate the uniformity of the amplification over the sample at different scales. Therefore, besides recording a set of spectra at distant points, we obtained, for the h Nanomaterials 2020, 10, 830 7 of 11 = 100 nm sample (optical image in Figure 5a), 121 spectra from 10 μm × 10 μm squares, 1 μm steps, that we can transform into Raman images of the 2D and D peak intensities (Figures 5b,c) and of the can transform into Raman images of the 2D and D peak intensities (Figure 5b,c) and of the Raman Raman enhancement factor E.F (Figure 5d). The 2D peak image (Figure 5b) shows a very uniform enhancement factor E.F (Figure 5d). The 2D peak image (Figure 5b) shows a very uniform intensity intensity with slightly lower intensity regions that correspond to the darker points of the optical with slightly lower intensity regions that correspond to the darker points of the optical image related to image related to micron-sized areas of bi/tri-layer graphene (Figure 5a) as we commented before. Just micron-sized areas of bi/tri-layer graphene (Figure 5a) as we commented before. Just the opposite occurs the opposite occurs to the D peak whose intensity is increased at the bilayer graphene regions. Finally, to the D peak whose intensity is increased at the bilayer graphene regions. Finally, the amplification, the amplification, except at the small bilayer regions, is very uniform with an average value of 370 ± except at the small bilayer regions, is very uniform with an average value of 370 ± 5%. Such Raman 5%. Such Raman amplification factors are remarkable and, interestingly, are obtained without the use amplification factors are remarkable and, interestingly, are obtained without the use of nanoparticles. of nanoparticles. Figure 5. (a) Optical image of graphene on a 100 nm membrane, the 10 μm × 10 μm white dashed square Figure 5. (a) Optical image of graphene on a 100 nm membrane, the 10 μm × 10 μm white dashed is the tested area in the Raman images of (b) D peak intensity, (c) 2D peak intensity and (d) enhancement square is the tested area in the Raman images of (b) D peak intensity, (c) 2D peak intensity and (d) factor E.F. = I2D (membrane)/I2D (fused silica). enhancement factor E.F. = I2D (membrane)/I2D (fused silica). Several characteristics of the membranes reduce the amplification for a perfect “air layer” obtained in theSseivmeruallatciohnasr.acOtenriosntiecshaonfdt,htehemcaelmcublraatnioenssrienduicaeteththeatamanpalilfuicmaitnioanbaforriear lpaeyrefrecptre“saeinrtlatytehre” boobttaoimnedofitnhethpeosreimsdulratsitoincasl.lyOdneopnletehsaanmd,ptlhifieccaatilocunl(aFtiognusrein6da)ic.aItneththisatfiagnuraeluthmeianmapbalirfircieartiolanyeisr cparlecsuelnateadtatshaefbuontcttoimonof thedpioerlecstrdicralsatyicearltlhyicdkenpelsest,etshaemdipeliefcictraitciobnein(Fgigfourmee6da)b.yInaitrhainsdfidguiffrerethnet fiaxmepdliafliucamtionnabisacrrailecrulaytedrsa(sthaicfkunecstsio:n2,o5f,t1h5eadnidel3e0ctnrimc)l.ayEevrenthaictkhnines5s,ntmheodfiAellecOtricbabreriinegrafolrremadeyd 23 rbeyduaicresanthdedmifafexrimenutmfixaemdpalliufimcaitnioanbtaorrviaelruleasybereslo(wthi4c0k0n,essims:i2la,r5,to15thaenedxp30ernime)n.EtavleEn.Fa.Othninth5enomtheorf hAaln2Od,3ubnafrorriteurnaltreelay,dtyherepdourecses(ththeeaimr)aoxcicmupuymonalmypaliffriaccatiionotfothveamluemsbrealnoew,s4o0t0h,atsitmheiladrielteocttrhice leaxypeerrismaentianl-pEl.aFn.eOcnotmhebiontahteironhaonfda,lumnfionratuanadtealyir,,twhehipcohreasls(othmeoadiri)fioecsctuhpeyinotnelryfearefnraccetiroenspoofnthse (mFiegmurbera6bn)e.,Tshoetehsattimthaetediferlaectiroicn loafypeorreis ainthine-phl=an1e00conmbsianmatpiolenoobftailnuemdifnroamanthdeaSiEr,Mwihmicahgeaslsiso amroudnifdie2s0t%h.eIintFeirgfueren6cebroetshpiossnuses(aFriegucorem6bbin).eTdhaendesEti.mF.ahtaesdbfereanctcioanlcuolfatpeodrefosri2n0t%hepohre= f1r0a0ctinomn asnamd dpilffe eorbetnatinveadlufersoomf the SalEuMminmaabgoetstoismarboaurrnider2(0%, 2. IanFdig5unrme )6.cTbhoethoisrsiuzoens tarlegcroemenbliinedinadnidcaEt.eFs. thaesebxepeenricmalecnutlatleEd.Ff.oorb2t0a%inpedorfeofrrathcetiohn=a1n0d0dnimffemrenemt vbarlaunees wofithegaoloudmcionianbcoidtteonmcebwarirthier20(0%, 2paonred f5rancmti)o.nThanedho0rnizmonatlaulmgrieneanblainrreiienr.dAiccacteosrdthinegextopecrailmcuelnataiolnEs.Ft.hoebatacitnueadldfoerptheohf=th1e00ponrmesmisemarboruande 9w0inthmgroaotdhecrotihnacnidtehnec1e0w0 intmh 2e0s%timpaotreedffrraocmtiotnheanSEdM0 nimagaleusmanindathbeartrieart.mAecnctotrodirnegdutocectahlceubloattiomns bthaerraiecrtuisaledffepctihveo.f the pores is around 90 nm rather than the 100 nm estimated from the SEM images andtFhienatrlleya,tm4enmttosirlevdeurcneatnhoepbaorttioclmesb(aNrrPiesr)iwsefrfecdtievpeo.sited[seeRefs. 4and34fortheNPs characterization] onto the graphene layer on top of the membrane to check the possibility to further enhance the Raman signal of graphene and of an analyte. A schema of the resulting membrane based system is plotted in Figure 7a). In this case we used Rhodamine 6G (R6G) to test the amplification capability. Ag NPs were simultaneously deposited on the membrane platform and on the referencePDF Image | Supported Ultra-Thin Alumina Membranes with Graphene
PDF Search Title:
Supported Ultra-Thin Alumina Membranes with GrapheneOriginal File Name Searched:
nanomaterials-10-00830-v2.pdfDIY PDF Search: Google It | Yahoo | Bing
Turbine and System Plans CAD CAM: Special for this month, any plans are $10,000 for complete Cad/Cam blueprints. License is for one build. Try before you buy a production license. More Info
Waste Heat Power Technology: Organic Rankine Cycle uses waste heat to make electricity, shaft horsepower and cooling. More Info
All Turbine and System Products: Infinity Turbine ORD systems, turbine generator sets, build plans and more to use your waste heat from 30C to 100C. More Info
CO2 Phase Change Demonstrator: CO2 goes supercritical at 30 C. This is a experimental platform which you can use to demonstrate phase change with low heat. Includes integration area for small CO2 turbine, static generator, and more. This can also be used for a GTL Gas to Liquids experimental platform. More Info
Introducing the Infinity Turbine Products Infinity Turbine develops and builds systems for making power from waste heat. It also is working on innovative strategies for storing, making, and deploying energy. More Info
Need Strategy? Use our Consulting and analyst services Infinity Turbine LLC is pleased to announce its consulting and analyst services. We have worked in the renewable energy industry as a researcher, developing sales and markets, along with may inventions and innovations. More Info
Made in USA with Global Energy Millennial Web Engine These pages were made with the Global Energy Web PDF Engine using Filemaker (Claris) software.
Infinity Turbine Developing Spinning Disc Reactor SDR or Spinning Disc Reactors reduce processing time for liquid production of Silver Nanoparticles.
| CONTACT TEL: 608-238-6001 Email: greg@infinityturbine.com | RSS | AMP |