PDF Publication Title:
Text from PDF Page: 006
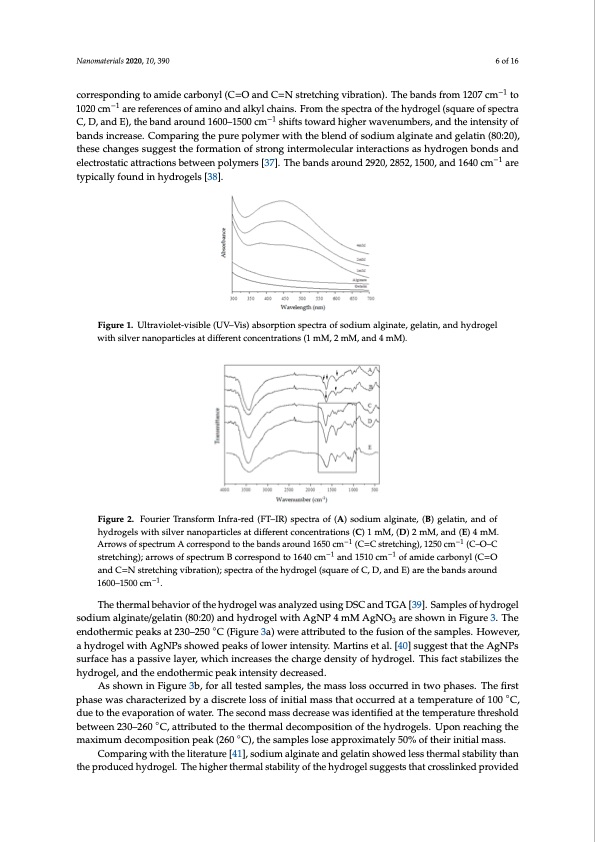
pharmaceutical dosage forms, becomes feasible in the field of tissue repair. After producing the hydrogels, silver nitrate was incorporated in the hydrogel in distinct concentrations (1.0, 2.0, and 4.0 mM), showing increasing changes in color, from white to dark brown. The dark brown indicates nanoparticle production. AgNPs have been synthesized applying a green approach and using a natural biopolymer. The polymers show the presence of hydroxyl and carboxylic acid groups in their polymeric units favoring the Ag+ chelate production by the adjacent Nanomaterials 20–2O0H, 1a0n, d39–0COOH groups of alginate and gelatin. The Ag+ also acts as a potent oxidizing agent for organic compounds [33]. The light incident on the nanoparticles produces oscillations in the electrons that are on their surface, with the consequent absorption of electromagnetic radiation. The optical properties of the 6 of 16 −1 corresponding to amide carbonyl (C=O and C=N stretching vibration). The bands from 1207 cm to −1 AgNPs-loaded hydrogels were evaluated by measuring the spectrum of UV–Vis spectroscopy are of spectra 1020 cm are references of amino and alkyl chains. From the spectra of the hydrogel (squ (Figure 1). It identifies the evolution of the plasmon band as a function of the concentration of Ag . −1 In the analysis of a spectrum UV–Vis, the bands of the plasmons are characterized by the absorption C, D, and E), the band around 1600–1500 cm shifts toward higher wavenumbers, and the intensity of of the AgNPs showing a maximum wavelength, which indicates the presence of AgNPs caused by bands increase. Comparing the pure polymer with the blend of sodium alginate and gelatin (80:20), the excitation of electromagnetic waves (plasmon) in the surface. The spheroidal AgNPs absorb at a thesechangewsavseulegngtehsbtethweenfo3r9m0–4a4t0ionnm,owfhsicthromnagyvinartyedrempeonldeicnguloanrthinetsiezreaacntdiointesracstiohnybdetrwoegenenbondsand Nanomaterials 2020, 10, x FOR PEER REVIEW 6 of 16 −1 the particles. The nanoparticle absorption spectra of this analysis showed a maximum band around electrostatic attractions between polymers [37]. The bands around 2920, 2852, 1500, and 1640 cm are 430–450 nm suggesting a spheroidal form. Other researchers developed hydrogel with natural typicallyfoundFiniguhrey1d.rUoltgraevliosle[t3-v8is]ib.le(UV–Vis)absorptionspectraofsodiumalginate,gelatin,andhydrogel polymer incorporating AgNPs and obtained similar results [34,35]. with silver nanoparticles at different concentrations (1 mM, 2 mM, and 4 mM). FT–IR was used to id possible interaction betwe Figure 2 shows the FT–IR s (1 mM, 2 mM, and 4 mM). the FT–IR spectrum of sodi around 1650 cm−1 (C=C st stretching) are attributed spectrum of gelatin is cha corresponding to amide ca 1020 cm–1 are references of a C, D, and E), the band aro of bands increase. Comparing the pure polymer with the blend of sodium alginate and gelatin (80:20), Figure 1. Ultraviolet-visible (UV–Vis) absorption spectra of sodium alginate, gelatin, and hydrogel these changes suggest the formation of strong intermolecular interactions as hydrogen bonds and withsilvelercntraonstoapticaarttircalcetsioantsdbeifftweerenptocloynmceersn[t3r7a]t.iTohnesb(a1ndmsMaro,u2nmd2M92,0a,n28d524,1m50M0,)a.nd1640cm−1 are typically found in hydrogels [38]. Figure 2. Fourier Transform Infra-red (FT–IR) spectra of (A) sodium alginate, (B) gelatin, and of Figure 2. Fourier Transform Infra-red (FT–IR) spectra of (A) sodium alginate, (B) gelatin, and of entify the characteristic bands of the present g en the functional groups of the molecules co pectra of sodium alginate, gelatin, and hydrogel The characteristic absorption bands at 1602 cm− um alginate correspond to the amide carbonyl g retching), 1250 cm−1 (C–O–C stretching), and to the polysaccharide structure (arrows of sp racterized by 1640 cm–1 and 1510 cm–1 (arrows rbonyl (C=O and C=N stretching vibration). The mino and alkyl chains. From the spectra of the h und 1600–1500 cm–1 shifts toward higher waven hydrogels with silver nanoparticles at different concentrations (C) 1 mM, (D) 2 mM, and (E) 4 mM. hydrogels with silver nanoparticles at different concentrations (C) 1 mM, (D) 2 mM, and (E) 4 mM. Arrows of spectrum A correspond to the bands around 1650 cm−1 (C=C stretching), 1250 cm−1 (C–O–C −1 Arrowsofspsetrcetrcuhimng)A;arcrowrrseosfpspoenctdrutmoBthcoerrbeaspnodndstaor1o6u40ncdm1 −1Co=faCmisdterecatrcbhoinnygl()C,=1O25an0dcm−1(C–O–C −16a5nd01c5m10 cm( C=N stretching vibration); spectra of the hydrogel (square of −C1, D, and E) are the b−an1ds around 1600– stretching); arrows of spectrum B correspond to 1640 cm and 1510 cm of amide carbonyl (C=O 1500 cm−1. and C=N stretching vibration); spectra of the hydrogel (square of C, D, and E) are the bands around −1 1600–1500 cmThe .thermal behavior of the hydrogel was analyzed using DSC and TGA [39]. Samples of hydrogel sodium alginate/gelatin (80:20) and hydrogel with AgNP 4 mM AgNO3 are shown in Figure The thermal behavior of the hydrogel was analyzed using DSC and TGA [39]. Samples of hydrogel 3. The endothermic peaks at 230–250 °C (Figure 3a) were attributed to the fusion of the samples. However, a hydrogel with AgNPs showed peaks of lower intensity. Martins et al. [40] suggest that sodium alginate/gelatin (80:20) and hydrogel with AgNP 4 mM AgNO3 are shown in Figure 3. The the AgNPs surface has a passive layer, which increases the charge density of hydrogel. This fact endothermic peaks at 230–250 ◦C (Figure 3a) were attributed to the fusion of the samples. However, stabilizes the hydrogel, and the endothermic peak intensity decreased. a hydrogel with AgNPs showed peaks of lower intensity. Martins et al. [40] suggest that the AgNPs As shown in Figure 3b, for all tested samples, the mass loss occurred in two phases. The first phase was characterized by a discrete loss of initial mass that occurred at a temperature of 100 °C, surface has a passive layer, which increases the charge density of hydrogel. This fact stabilizes the due to the evaporation of water. The second mass decrease was identified at the temperature hydrogel, and the endothermic peak intensity decreased. threshold between 230–260 °C, attributed to the thermal decomposition of the hydrogels. Upon reaching the maximum decomposition peak (260 °C), the samples lose approximately 50% of their As shown in Figure 3b, for all tested samples, the mass loss occurred in two phases. The first initial mass. ◦ phase was characterized by a discrete loss of initial mass that occurred at a temperature of 100 C, due to the evaporation of water. The second mass decrease was identified at the temperature threshold between 230–260 ◦C, attributed to the thermal decomposition of the hydrogels. Upon reaching the maximum decomposition peak (260 ◦C), the samples lose approximately 50% of their initial mass. Comparing with the literature [41], sodium alginate and gelatin showed less thermal stability than the produced hydrogel. The higher thermal stability of the hydrogel suggests that crosslinked provided roups and to observe the mposing the formulation. with silver nanoparticles 1 and 1424 cm−1 shown in roup [36]. Also, the bands 1250 and 1100 cm−1 (C–O ectrum A, Figure 2). The of spectrum B, Figure 2), bands from 1207 cm–1 to ydrogel (square of spectra umbers, and the intensity +PDF Image | Wound Healing Silver Nanoparticles-Composing Hydrogel
PDF Search Title:
Wound Healing Silver Nanoparticles-Composing HydrogelOriginal File Name Searched:
nanomaterials-10-00390-v2.pdfDIY PDF Search: Google It | Yahoo | Bing
Turbine and System Plans CAD CAM: Special for this month, any plans are $10,000 for complete Cad/Cam blueprints. License is for one build. Try before you buy a production license. More Info
Waste Heat Power Technology: Organic Rankine Cycle uses waste heat to make electricity, shaft horsepower and cooling. More Info
All Turbine and System Products: Infinity Turbine ORD systems, turbine generator sets, build plans and more to use your waste heat from 30C to 100C. More Info
CO2 Phase Change Demonstrator: CO2 goes supercritical at 30 C. This is a experimental platform which you can use to demonstrate phase change with low heat. Includes integration area for small CO2 turbine, static generator, and more. This can also be used for a GTL Gas to Liquids experimental platform. More Info
Introducing the Infinity Turbine Products Infinity Turbine develops and builds systems for making power from waste heat. It also is working on innovative strategies for storing, making, and deploying energy. More Info
Need Strategy? Use our Consulting and analyst services Infinity Turbine LLC is pleased to announce its consulting and analyst services. We have worked in the renewable energy industry as a researcher, developing sales and markets, along with may inventions and innovations. More Info
Made in USA with Global Energy Millennial Web Engine These pages were made with the Global Energy Web PDF Engine using Filemaker (Claris) software.
Infinity Turbine Developing Spinning Disc Reactor SDR or Spinning Disc Reactors reduce processing time for liquid production of Silver Nanoparticles.
| CONTACT TEL: 608-238-6001 Email: greg@infinityturbine.com | RSS | AMP |