PDF Publication Title:
Text from PDF Page: 003
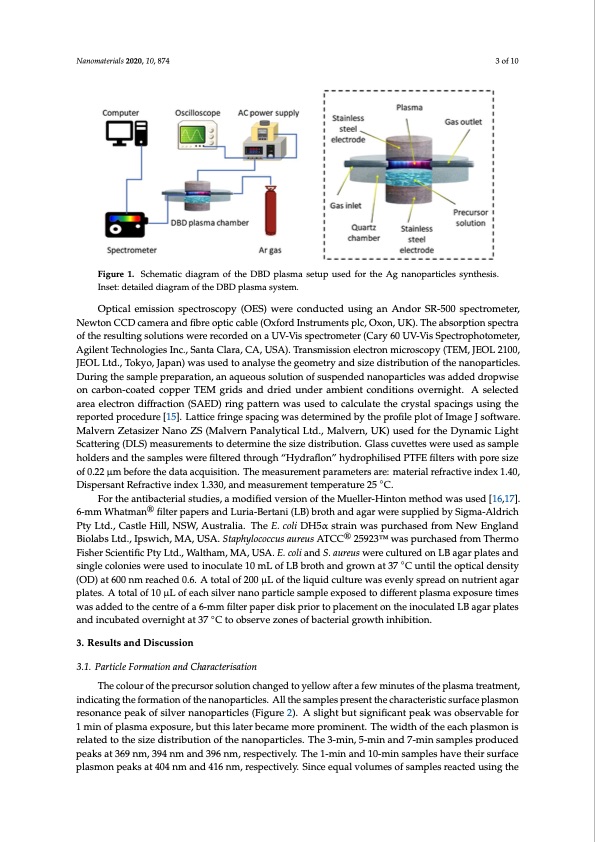
Nanomaterials 2020, 10, x FOR PEER REVIEW 3 of 10 and frequency were 30 kV and 9.1 kHz, respectively. Voltage and current measurements were made Nanomaterials 2020, 10, 874 3 of 10 using Rigol DS6104 oscilloscope. Figure 1. Schematic diagram of the DBD plasma setup used for the Ag nanoparticles synthesis. Inset: detailed diagram of the DBD plasma system. Figure 1. Schematic diagram of the DBD plasma setup used for the Ag nanoparticles synthesis. Inset: detailed diagram of the DBD plasma system. Optical emission spectroscopy (OES) were conducted using an Andor SR-500 spectrometer, Newton CCD camera and fibre optic cable (Oxford Instruments plc, Oxon, UK). The absorption spectra Optical emission spectroscopy (OES) were conducted using an Andor SR‐500 spectrometer, of the resulting solutions were recorded on a UV-Vis spectrometer (Cary 60 UV-Vis Spectrophotometer, Newton CCD camera and fibre optic cable (Oxford Instruments plc, Oxon, UK). The absorption Agilent Technologies Inc., Santa Clara, CA, USA). Transmission electron microscopy (TEM, JEOL 2100, spectra of the resulting solutions were recorded on a UV‐Vis spectrometer (Cary 60 UV‐Vis JEOSLpeLctdro.,pThoktoymo,eJtaepr,anA)gwilaesntusTeedchtonoanloagliyese tIhnce,gSeoanmtaetrCylarnad, sCizAe,dUisStrAib).utTiornanosfmthisesinoannoepleacrtrtiocnles. Dumrinicgrothsceospaym(pTlEeMp,reJEpOarLat2io10n0, ,aJnEOaqLuLeotdu,sTsokluytoi,oJnapoaf ns)uwspaesnudseedntaonaonpaalyrtsiecltehsewgaesomadedtreydadnrdopsiwzeise on dciasrtbriobnu-tcionatoefdthceonpapneorpTarEtMiclegs.riDdusraingdthderiseadmupnledperepaamrabtiieont, acnonadquiteionus soovluertinoinghotf.suAspseenldeecdted nanoparticles was added dropwise on carbon‐coated copper TEM grids and dried under ambient area electron diffraction (SAED) ring pattern was used to calculate the crystal spacings using the conditions overnight. A selected area electron diffraction (SAED) ring pattern was used to calculate reported procedure [15]. Lattice fringe spacing was determined by the profile plot of Image J software. the crystal spacings using the reported procedure [15]. Lattice fringe spacing was determined by the Malvern Zetasizer Nano ZS (Malvern Panalytical Ltd., Malvern, UK) used for the Dynamic Light profile plot of Image J software. Malvern Zetasizer Nano ZS (Malvern Panalytical Ltd, Malvern, UK) Scattering (DLS) measurements to determine the size distribution. Glass cuvettes were used as sample used for the Dynamic Light Scattering (DLS) measurements to determine the size distribution. Glass holders and the samples were filtered through “Hydraflon” hydrophilised PTFE filters with pore size cuvettes were used as sample holders and the samples were filtered through “Hydraflon” of 0.22 μm before the data acquisition. The measurement parameters are: material refractive index 1.40, hydrophilised PTFE filters with pore size of 0.22 μm before the data acquisition. The measurement Dispersant Refractive index 1.330, and measurement temperature 25 ◦C. parameters are: material refractive index 1.40, Dispersant Refractive index 1.330, and measurement For the antibacterial studies, a modified version of the Mueller-Hinton method was used [16,17]. temperature 25 °C. 6-mm Whatman® filter papers and Luria-Bertani (LB) broth and agar were supplied by Sigma-Aldrich For the antibacterial studies, a modified version of the Mueller‐Hinton method was used [16,17]. Pty Ltd., Castle Hill, NSW, Australia. The E. coli DH5α strain was purchased from New England 6‐mm Whatman® filter papers and Luria‐Bertani (LB) broth and agar were supplied by Sigma‐Aldrich Biolabs Ltd., Ipswich, MA, USA. Staphylococcus aureus ATCC® 25923TM was purchased from Thermo Pty Ltd, Castle Hill, NSW, Australia. The E. coli DH5α strain was purchased from New England Fisher Scientific Pty Ltd., Waltham, MA, USA. E. coli and S. aureus were cultured on LB agar plates and Biolabs Ltd, Ipswich, MA, USA. Staphylococcus aureus ATCC® 25923TM was purchased from Thermo single colonies were used to inoculate 10 mL of LB broth and grown at 37 ◦C until the optical density Fisher Scientific Pty Ltd, Waltham, MA, USA. E. coli and S. aureus were cultured on LB agar plates (OD) at 600 nm reached 0.6. A total of 200 μL of the liquid culture was evenly spread on nutrient agar and single colonies were used to inoculate 10 mL of LB broth and grown at 37 °C until the optical plates. A total of 10 μL of each silver nano particle sample exposed to different plasma exposure times density (OD) at 600 nm reached 0.6. A total of 200 μL of the liquid culture was evenly spread on wasnuadtrdiendttaogathrepclaetnetsr.eAoftoata6l-mofm10fiμltLeropfaeapcehrdsiilsvkerpnriaonrotopaprltaicleemseanmtpolneethxepoinseodcutoladteidffeLrBenatgpalraspmlaates ◦ andexinpcousubraetetdimoevserwnaigshatdadte3d7toCthoeocbesnetrrveeozfonae6s‐mofmbafcitleterriaplagproerwdthisiknhpirbioitriotno.placement on the inoculated LB agar plates and incubated overnight at 37 °C to observe zones of bacterial growth 3. Results and Discussion inhibition. 3.1. Particle Formation and Characterisation 3. Results and Discussion The colour of the precursor solution changed to yellow after a few minutes of the plasma treatment, 3.1. Particle Formation and Characterisation indicating the formation of the nanoparticles. All the samples present the characteristic surface plasmon resonance peak of silver nanoparticles (Figure 2). A slight but significant peak was observable for 1 min of plasma exposure, but this later became more prominent. The width of the each plasmon is related to the size distribution of the nanoparticles. The 3-min, 5-min and 7-min samples produced peaks at 369 nm, 394 nm and 396 nm, respectively. The 1-min and 10-min samples have their surface plasmon peaks at 404 nm and 416 nm, respectively. Since equal volumes of samples reacted using thePDF Image | Bactericidal Silver Nanoparticles by Plasma Processing
PDF Search Title:
Bactericidal Silver Nanoparticles by Plasma ProcessingOriginal File Name Searched:
nanomaterials-10-00874.pdfDIY PDF Search: Google It | Yahoo | Bing
Turbine and System Plans CAD CAM: Special for this month, any plans are $10,000 for complete Cad/Cam blueprints. License is for one build. Try before you buy a production license. More Info
Waste Heat Power Technology: Organic Rankine Cycle uses waste heat to make electricity, shaft horsepower and cooling. More Info
All Turbine and System Products: Infinity Turbine ORD systems, turbine generator sets, build plans and more to use your waste heat from 30C to 100C. More Info
CO2 Phase Change Demonstrator: CO2 goes supercritical at 30 C. This is a experimental platform which you can use to demonstrate phase change with low heat. Includes integration area for small CO2 turbine, static generator, and more. This can also be used for a GTL Gas to Liquids experimental platform. More Info
Introducing the Infinity Turbine Products Infinity Turbine develops and builds systems for making power from waste heat. It also is working on innovative strategies for storing, making, and deploying energy. More Info
Need Strategy? Use our Consulting and analyst services Infinity Turbine LLC is pleased to announce its consulting and analyst services. We have worked in the renewable energy industry as a researcher, developing sales and markets, along with may inventions and innovations. More Info
Made in USA with Global Energy Millennial Web Engine These pages were made with the Global Energy Web PDF Engine using Filemaker (Claris) software.
Infinity Turbine Developing Spinning Disc Reactor SDR or Spinning Disc Reactors reduce processing time for liquid production of Silver Nanoparticles.
| CONTACT TEL: 608-238-6001 Email: greg@infinityturbine.com | RSS | AMP |