PDF Publication Title:
Text from PDF Page: 005
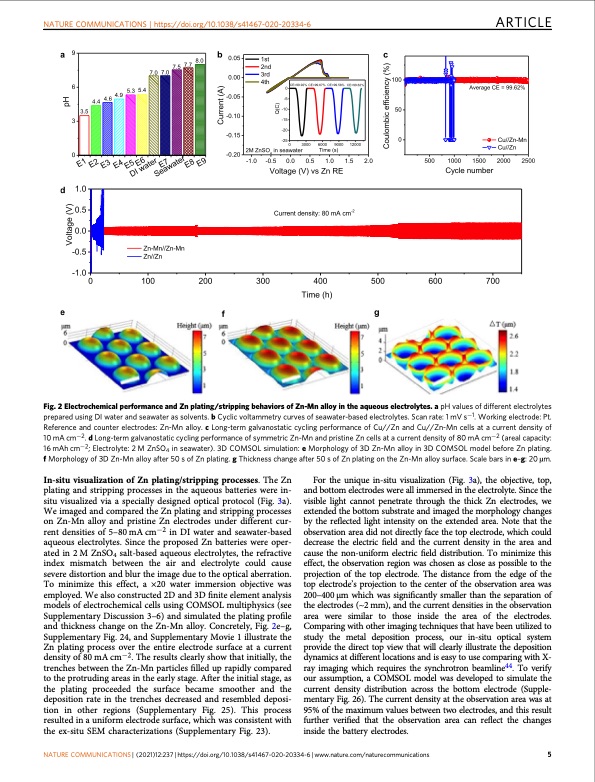
NATURE COMMUNICATIONS | https://doi.org/10.1038/s41467-020-20334-6 ARTICLE Fig. 2 Electrochemical performance and Zn plating/stripping behaviors of Zn-Mn alloy in the aqueous electrolytes. a pH values of different electrolytes prepared using DI water and seawater as solvents. b Cyclic voltammetry curves of seawater-based electrolytes. Scan rate: 1 mV s−1. Working electrode: Pt. Reference and counter electrodes: Zn-Mn alloy. c Long-term galvanostatic cycling performance of Cu//Zn and Cu//Zn-Mn cells at a current density of 10 mA cm−2. d Long-term galvanostatic cycling performance of symmetric Zn-Mn and pristine Zn cells at a current density of 80 mA cm−2 (areal capacity: 16 mAh cm−2; Electrolyte: 2 M ZnSO4 in seawater). 3D COMSOL simulation: e Morphology of 3D Zn-Mn alloy in 3D COMSOL model before Zn plating. f Morphology of 3D Zn-Mn alloy after 50 s of Zn plating. g Thickness change after 50 s of Zn plating on the Zn-Mn alloy surface. Scale bars in e–g: 20 μm. In-situ visualization of Zn plating/stripping processes. The Zn plating and stripping processes in the aqueous batteries were in- situ visualized via a specially designed optical protocol (Fig. 3a). We imaged and compared the Zn plating and stripping processes on Zn-Mn alloy and pristine Zn electrodes under different cur- rent densities of 5–80 mA cm−2 in DI water and seawater-based aqueous electrolytes. Since the proposed Zn batteries were oper- ated in 2 M ZnSO4 salt-based aqueous electrolytes, the refractive index mismatch between the air and electrolyte could cause severe distortion and blur the image due to the optical aberration. To minimize this effect, a ×20 water immersion objective was employed. We also constructed 2D and 3D finite element analysis models of electrochemical cells using COMSOL multiphysics (see Supplementary Discussion 3–6) and simulated the plating profile and thickness change on the Zn-Mn alloy. Concretely, Fig. 2e–g, Supplementary Fig. 24, and Supplementary Movie 1 illustrate the Zn plating process over the entire electrode surface at a current density of 80 mA cm−2. The results clearly show that initially, the trenches between the Zn-Mn particles filled up rapidly compared to the protruding areas in the early stage. After the initial stage, as the plating proceeded the surface became smoother and the deposition rate in the trenches decreased and resembled deposi- tion in other regions (Supplementary Fig. 25). This process resulted in a uniform electrode surface, which was consistent with the ex-situ SEM characterizations (Supplementary Fig. 23). For the unique in-situ visualization (Fig. 3a), the objective, top, and bottom electrodes were all immersed in the electrolyte. Since the visible light cannot penetrate through the thick Zn electrodes, we extended the bottom substrate and imaged the morphology changes by the reflected light intensity on the extended area. Note that the observation area did not directly face the top electrode, which could decrease the electric field and the current density in the area and cause the non-uniform electric field distribution. To minimize this effect, the observation region was chosen as close as possible to the projection of the top electrode. The distance from the edge of the top electrode’s projection to the center of the observation area was 200–400 μm which was significantly smaller than the separation of the electrodes (~2 mm), and the current densities in the observation area were similar to those inside the area of the electrodes. Comparing with other imaging techniques that have been utilized to study the metal deposition process, our in-situ optical system provide the direct top view that will clearly illustrate the deposition dynamics at different locations and is easy to use comparing with X- ray imaging which requires the synchrotron beamline44. To verify our assumption, a COMSOL model was developed to simulate the current density distribution across the bottom electrode (Supple- mentary Fig. 26). The current density at the observation area was at 95% of the maximum values between two electrodes, and this result further verified that the observation area can reflect the changes inside the battery electrodes. NATURE COMMUNICATIONS | (2021)12:237 | https://doi.org/10.1038/s41467-020-20334-6 | www.nature.com/naturecommunications 5PDF Image | high-performance dendrite-free seawater-based batteries
PDF Search Title:
high-performance dendrite-free seawater-based batteriesOriginal File Name Searched:
s41467-020-20334-6.pdfDIY PDF Search: Google It | Yahoo | Bing
Product and Development Focus for Infinity Turbine
ORC Waste Heat Turbine and ORC System Build Plans: All turbine plans are $10,000 each. This allows you to build a system and then consider licensing for production after you have completed and tested a unit.Redox Flow Battery Technology: With the advent of the new USA tax credits for producing and selling batteries ($35/kW) we are focussing on a simple flow battery using shipping containers as the modular electrolyte storage units with tax credits up to $140,000 per system. Our main focus is on the salt battery. This battery can be used for both thermal and electrical storage applications. We call it the Cogeneration Battery or Cogen Battery. One project is converting salt (brine) based water conditioners to simultaneously produce power. In addition, there are many opportunities to extract Lithium from brine (salt lakes, groundwater, and producer water).Salt water or brine are huge sources for lithium. Most of the worlds lithium is acquired from a brine source. It's even in seawater in a low concentration. Brine is also a byproduct of huge powerplants, which can now use that as an electrolyte and a huge flow battery (which allows storage at the source).We welcome any business and equipment inquiries, as well as licensing our turbines for manufacturing.| CONTACT TEL: 608-238-6001 Email: greg@infinityturbine.com | RSS | AMP |