PDF Publication Title:
Text from PDF Page: 057
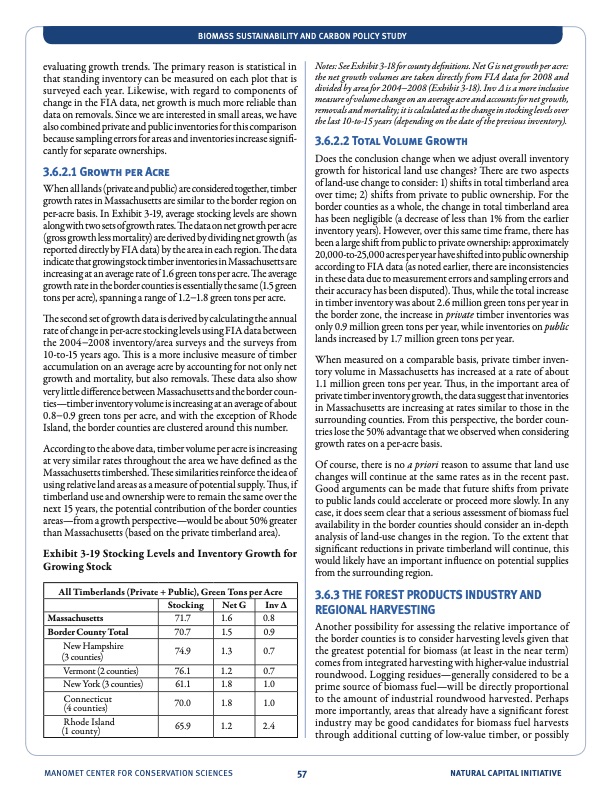
evaluating growth trends. The primary reason is statistical in that standing inventory can be measured on each plot that is surveyed each year. Likewise, with regard to components of change in the FIA data, net growth is much more reliable than data on removals. Since we are interested in small areas, we have also combined private and public inventories for this comparison because sampling errors for areas and inventories increase signifi- cantly for separate ownerships. 3.6.2.1 Growth per Acre When all lands (private and public) are considered together, timber growth rates in Massachusetts are similar to the border region on per-acre basis. In Exhibit 3-19, average stocking levels are shown along with two sets of growth rates. The data on net growth per acre (gross growth less mortality) are derived by dividing net growth (as reported directly by FIA data) by the area in each region. The data indicate that growing stock timber inventories in Massachusetts are increasing at an average rate of 1.6 green tons per acre. The average growth rate in the border counties is essentially the same (1.5 green tons per acre), spanning a range of 1.2−1.8 green tons per acre. The second set of growth data is derived by calculating the annual rate of change in per-acre stocking levels using FIA data between the 2004−2008 inventory/area surveys and the surveys from 10-to-15 years ago. This is a more inclusive measure of timber accumulation on an average acre by accounting for not only net growth and mortality, but also removals. These data also show very little difference between Massachusetts and the border coun- ties—timber inventory volume is increasing at an average of about 0.8−0.9 green tons per acre, and with the exception of Rhode Island, the border counties are clustered around this number. According to the above data, timber volume per acre is increasing at very similar rates throughout the area we have defined as the Massachusetts timbershed. These similarities reinforce the idea of using relative land areas as a measure of potential supply. Thus, if timberland use and ownership were to remain the same over the next 15 years, the potential contribution of the border counties areas—from a growth perspective—would be about 50% greater than Massachusetts (based on the private timberland area). Exhibit 3-19 Stocking Levels and Inventory Growth for Growing Stock All Timberlands (Private + Public), Green Tons per Acre Notes: See Exhibit 3-18 for county definitions. Net G is net growth per acre: the net growth volumes are taken directly from FIA data for 2008 and divided by area for 2004−2008 (Exhibit 3-18). Inv Δ is a more inclusive measure of volume change on an average acre and accounts for net growth, removals and mortality; it is calculated as the change in stocking levels over the last 10-to-15 years (depending on the date of the previous inventory). 3.6.2.2 Total Volume Growth Does the conclusion change when we adjust overall inventory growth for historical land use changes? There are two aspects of land-use change to consider: 1) shifts in total timberland area over time; 2) shifts from private to public ownership. For the border counties as a whole, the change in total timberland area has been negligible (a decrease of less than 1% from the earlier inventory years). However, over this same time frame, there has been a large shift from public to private ownership: approximately 20,000-to-25,000 acres per year have shifted into public ownership according to FIA data (as noted earlier, there are inconsistencies in these data due to measurement errors and sampling errors and their accuracy has been disputed). Thus, while the total increase in timber inventory was about 2.6 million green tons per year in the border zone, the increase in private timber inventories was only 0.9 million green tons per year, while inventories on public lands increased by 1.7 million green tons per year. When measured on a comparable basis, private timber inven- tory volume in Massachusetts has increased at a rate of about 1.1 million green tons per year. Thus, in the important area of private timber inventory growth, the data suggest that inventories in Massachusetts are increasing at rates similar to those in the surrounding counties. From this perspective, the border coun- tries lose the 50% advantage that we observed when considering growth rates on a per-acre basis. Of course, there is no a priori reason to assume that land use changes will continue at the same rates as in the recent past. Good arguments can be made that future shifts from private to public lands could accelerate or proceed more slowly. In any case, it does seem clear that a serious assessment of biomass fuel availability in the border counties should consider an in-depth analysis of land-use changes in the region. To the extent that significant reductions in private timberland will continue, this would likely have an important influence on potential supplies from the surrounding region. 3.6.3 THE FOREST PRODUCTS INDUSTRY AND REGIONAL HARVESTING Another possibility for assessing the relative importance of the border counties is to consider harvesting levels given that the greatest potential for biomass (at least in the near term) comes from integrated harvesting with higher-value industrial roundwood. Logging residues—generally considered to be a prime source of biomass fuel—will be directly proportional to the amount of industrial roundwood harvested. Perhaps more importantly, areas that already have a significant forest industry may be good candidates for biomass fuel harvests through additional cutting of low-value timber, or possibly BIOMASS SUSTAINABILITY AND CARBON POLICY STUDY Stocking Massachusetts 71.7 Border County Total 70.7 New Hampshire 74.9 (3 counties) Vermont (2 counties) 76.1 New York (3 counties) 61.1 Connecticut 70.0 (4 counties) Net G Inv Δ 1.6 0.8 1.5 0.9 1.3 0.7 1.2 0.7 1.8 1.0 1.8 1.0 Rhode Island (1 county) 65.9 1.2 2.4 MANOMET CENTER FOR CONSERVATION SCIENCES 57 NATURAL CAPITAL INITIATIVEPDF Image | NATURAL CAPITAL INITIATIVE AT MANOMET
PDF Search Title:
NATURAL CAPITAL INITIATIVE AT MANOMETOriginal File Name Searched:
manomet_biomass_report_full_hirez.pdfDIY PDF Search: Google It | Yahoo | Bing
NFT (Non Fungible Token): Buy our tech, design, development or system NFT and become part of our tech NFT network... More Info
IT XR Project Redstone NFT Available for Sale: NFT for high tech turbine design with one part 3D printed counter-rotating energy turbine. Be part of the future with this NFT. Can be bought and sold but only one design NFT exists. Royalties go to the developer (Infinity) to keep enhancing design and applications... More Info
Infinity Turbine IT XR Project Redstone Design: NFT for sale... NFT for high tech turbine design with one part 3D printed counter-rotating energy turbine. Includes all rights to this turbine design, including license for Fluid Handling Block I and II for the turbine assembly and housing. The NFT includes the blueprints (cad/cam), revenue streams, and all future development of the IT XR Project Redstone... More Info
Infinity Turbine ROT Radial Outflow Turbine 24 Design and Worldwide Rights: NFT for sale... NFT for the ROT 24 energy turbine. Be part of the future with this NFT. This design can be bought and sold but only one design NFT exists. You may manufacture the unit, or get the revenues from its sale from Infinity Turbine. Royalties go to the developer (Infinity) to keep enhancing design and applications... More Info
Infinity Supercritical CO2 10 Liter Extractor Design and Worldwide Rights: The Infinity Supercritical 10L CO2 extractor is for botanical oil extraction, which is rich in terpenes and can produce shelf ready full spectrum oil. With over 5 years of development, this industry leader mature extractor machine has been sold since 2015 and is part of many profitable businesses. The process can also be used for electrowinning, e-waste recycling, and lithium battery recycling, gold mining electronic wastes, precious metals. CO2 can also be used in a reverse fuel cell with nafion to make a gas-to-liquids fuel, such as methanol, ethanol and butanol or ethylene. Supercritical CO2 has also been used for treating nafion to make it more effective catalyst. This NFT is for the purchase of worldwide rights which includes the design. More Info
NFT (Non Fungible Token): Buy our tech, design, development or system NFT and become part of our tech NFT network... More Info
Infinity Turbine Products: Special for this month, any plans are $10,000 for complete Cad/Cam blueprints. License is for one build. Try before you buy a production license. May pay by Bitcoin or other Crypto. Products Page... More Info
| CONTACT TEL: 608-238-6001 Email: greg@infinityturbine.com | RSS | AMP |