
PDF Publication Title:
Text from PDF Page: 142
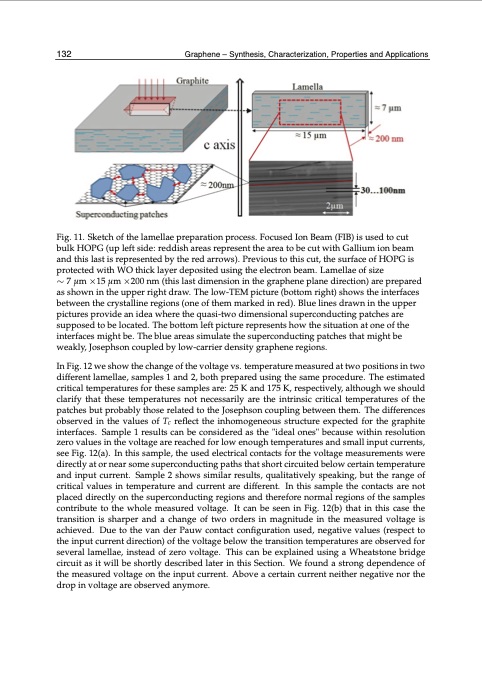
1832 Graphene – Synthesis, Characterization, Properties anWdill-bAe-psept-lbiyc-IaN-tTiEoCnHs Fig. 11. Sketch of the lamellae preparation process. Focused Ion Beam (FIB) is used to cut bulk HOPG (up left side: reddish areas represent the area to be cut with Gallium ion beam and this last is represented by the red arrows). Previous to this cut, the surface of HOPG is protected with WO thick layer deposited using the electron beam. Lamellae of size ∼ 7 μm ×15 μm ×200 nm (this last dimension in the graphene plane direction) are prepared as shown in the upper right draw. The low-TEM picture (bottom right) shows the interfaces between the crystalline regions (one of them marked in red). Blue lines drawn in the upper pictures provide an idea where the quasi-two dimensional superconducting patches are supposed to be located. The bottom left picture represents how the situation at one of the interfaces might be. The blue areas simulate the superconducting patches that might be weakly, Josephson coupled by low-carrier density graphene regions. In Fig. 12 we show the change of the voltage vs. temperature measured at two positions in two different lamellae, samples 1 and 2, both prepared using the same procedure. The estimated critical temperatures for these samples are: 25 K and 175 K, respectively, although we should clarify that these temperatures not necessarily are the intrinsic critical temperatures of the patches but probably those related to the Josephson coupling between them. The differences observed in the values of Tc reflect the inhomogeneous structure expected for the graphite interfaces. Sample 1 results can be considered as the "ideal ones" because within resolution zero values in the voltage are reached for low enough temperatures and small input currents, see Fig. 12(a). In this sample, the used electrical contacts for the voltage measurements were directly at or near some superconducting paths that short circuited below certain temperature and input current. Sample 2 shows similar results, qualitatively speaking, but the range of critical values in temperature and current are different. In this sample the contacts are not placed directly on the superconducting regions and therefore normal regions of the samples contribute to the whole measured voltage. It can be seen in Fig. 12(b) that in this case the transition is sharper and a change of two orders in magnitude in the measured voltage is achieved. Due to the van der Pauw contact configuration used, negative values (respect to the input current direction) of the voltage below the transition temperatures are observed for several lamellae, instead of zero voltage. This can be explained using a Wheatstone bridge circuit as it will be shortly described later in this Section. We found a strong dependence of the measured voltage on the input current. Above a certain current neither negative nor the drop in voltage are observed anymore.PDF Image | GRAPHENE SYNTHESIS CHARACTERIZATION PROPERTIES
PDF Search Title:
GRAPHENE SYNTHESIS CHARACTERIZATION PROPERTIESOriginal File Name Searched:
Graphene-Synthesis.pdfDIY PDF Search: Google It | Yahoo | Bing
Salgenx Redox Flow Battery Technology: Power up your energy storage game with Salgenx Salt Water Battery. With its advanced technology, the flow battery provides reliable, scalable, and sustainable energy storage for utility-scale projects. Upgrade to a Salgenx flow battery today and take control of your energy future.
| CONTACT TEL: 608-238-6001 Email: greg@infinityturbine.com | RSS | AMP |