PDF Publication Title:
Text from PDF Page: 065
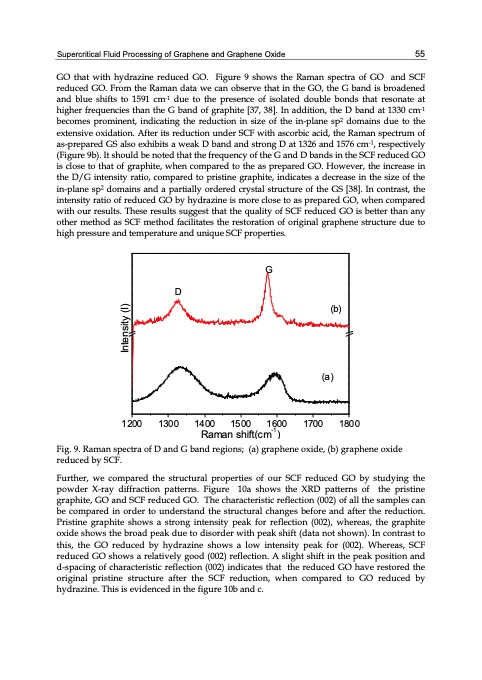
Supercritical Fluid Processing of Graphene and Graphene Oxide 55 GO that with hydrazine reduced GO. Figure 9 shows the Raman spectra of GO and SCF reduced GO. From the Raman data we can observe that in the GO, the G band is broadened and blue shifts to 1591 cm-1 due to the presence of isolated double bonds that resonate at higher frequencies than the G band of graphite [37, 38]. In addition, the D band at 1330 cm-1 becomes prominent, indicating the reduction in size of the in-plane sp2 domains due to the extensive oxidation. After its reduction under SCF with ascorbic acid, the Raman spectrum of as-prepared GS also exhibits a weak D band and strong D at 1326 and 1576 cm-1, respectively (Figure 9b). It should be noted that the frequency of the G and D bands in the SCF reduced GO is close to that of graphite, when compared to the as prepared GO. However, the increase in the D/G intensity ratio, compared to pristine graphite, indicates a decrease in the size of the in-plane sp2 domains and a partially ordered crystal structure of the GS [38]. In contrast, the intensity ratio of reduced GO by hydrazine is more close to as prepared GO, when compared with our results. These results suggest that the quality of SCF reduced GO is better than any other method as SCF method facilitates the restoration of original graphene structure due to high pressure and temperature and unique SCF properties. 1 200 130 0 14 00 15 00 1 600 1700 180 0 Raman shift(cm-1) Fig. 9. Raman spectra of D and G band regions; (a) graphene oxide, (b) graphene oxide reduced by SCF. Further, we compared the structural properties of our SCF reduced GO by studying the powder X-ray diffraction patterns. Figure 10a shows the XRD patterns of the pristine graphite, GO and SCF reduced GO. The characteristic reflection (002) of all the samples can be compared in order to understand the structural changes before and after the reduction. Pristine graphite shows a strong intensity peak for reflection (002), whereas, the graphite oxide shows the broad peak due to disorder with peak shift (data not shown). In contrast to this, the GO reduced by hydrazine shows a low intensity peak for (002). Whereas, SCF reduced GO shows a relatively good (002) reflection. A slight shift in the peak position and d-spacing of characteristic reflection (002) indicates that the reduced GO have restored the original pristine structure after the SCF reduction, when compared to GO reduced by hydrazine. This is evidenced in the figure 10b and c. G D (b) (a) Intensity (I)PDF Image | GRAPHENE SYNTHESIS CHARACTERIZATION PROPERTIES
PDF Search Title:
GRAPHENE SYNTHESIS CHARACTERIZATION PROPERTIESOriginal File Name Searched:
Graphene-Synthesis.pdfDIY PDF Search: Google It | Yahoo | Bing
Salgenx Redox Flow Battery Technology: Power up your energy storage game with Salgenx Salt Water Battery. With its advanced technology, the flow battery provides reliable, scalable, and sustainable energy storage for utility-scale projects. Upgrade to a Salgenx flow battery today and take control of your energy future.
| CONTACT TEL: 608-238-6001 Email: greg@infinityturbine.com | RSS | AMP |