PDF Publication Title:
Text from PDF Page: 059
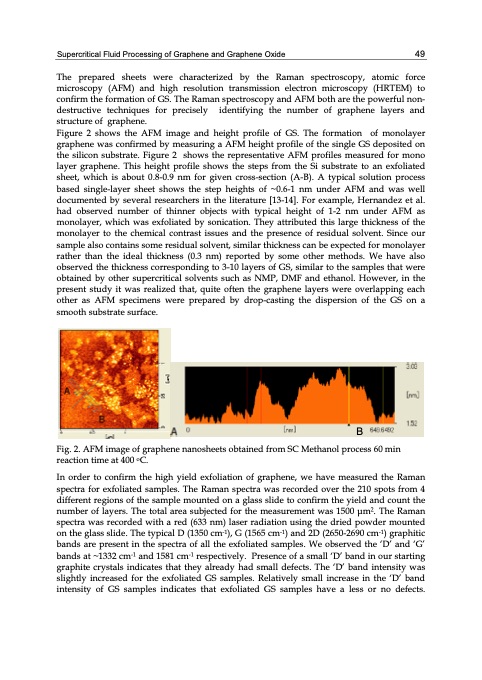
Supercritical Fluid Processing of Graphene and Graphene Oxide 49 The prepared sheets were characterized by the Raman spectroscopy, atomic force microscopy (AFM) and high resolution transmission electron microscopy (HRTEM) to confirm the formation of GS. The Raman spectroscopy and AFM both are the powerful non- destructive techniques for precisely identifying the number of graphene layers and structure of graphene. Figure 2 shows the AFM image and height profile of GS. The formation of monolayer graphene was confirmed by measuring a AFM height profile of the single GS deposited on the silicon substrate. Figure 2 shows the representative AFM profiles measured for mono layer graphene. This height profile shows the steps from the Si substrate to an exfoliated sheet, which is about 0.8-0.9 nm for given cross-section (A-B). A typical solution process based single-layer sheet shows the step heights of ~0.6-1 nm under AFM and was well documented by several researchers in the literature [13-14]. For example, Hernandez et al. had observed number of thinner objects with typical height of 1-2 nm under AFM as monolayer, which was exfoliated by sonication. They attributed this large thickness of the monolayer to the chemical contrast issues and the presence of residual solvent. Since our sample also contains some residual solvent, similar thickness can be expected for monolayer rather than the ideal thickness (0.3 nm) reported by some other methods. We have also observed the thickness corresponding to 3-10 layers of GS, similar to the samples that were obtained by other supercritical solvents such as NMP, DMF and ethanol. However, in the present study it was realized that, quite often the graphene layers were overlapping each other as AFM specimens were prepared by drop-casting the dispersion of the GS on a smooth substrate surface. B Fig. 2. AFM image of graphene nanosheets obtained from SC Methanol process 60 min reaction time at 400 oC. In order to confirm the high yield exfoliation of graphene, we have measured the Raman spectra for exfoliated samples. The Raman spectra was recorded over the 210 spots from 4 different regions of the sample mounted on a glass slide to confirm the yield and count the number of layers. The total area subjected for the measurement was 1500 μm2. The Raman spectra was recorded with a red (633 nm) laser radiation using the dried powder mounted on the glass slide. The typical D (1350 cm-1), G (1565 cm-1) and 2D (2650-2690 cm-1) graphitic bands are present in the spectra of all the exfoliated samples. We observed the ‘D’ and ‘G’ bands at ~1332 cm-1 and 1581 cm-1 respectively. Presence of a small ‘D’ band in our starting graphite crystals indicates that they already had small defects. The ‘D’ band intensity was slightly increased for the exfoliated GS samples. Relatively small increase in the ‘D’ band intensity of GS samples indicates that exfoliated GS samples have a less or no defects.PDF Image | GRAPHENE SYNTHESIS CHARACTERIZATION PROPERTIES
PDF Search Title:
GRAPHENE SYNTHESIS CHARACTERIZATION PROPERTIESOriginal File Name Searched:
Graphene-Synthesis.pdfDIY PDF Search: Google It | Yahoo | Bing
Salgenx Redox Flow Battery Technology: Power up your energy storage game with Salgenx Salt Water Battery. With its advanced technology, the flow battery provides reliable, scalable, and sustainable energy storage for utility-scale projects. Upgrade to a Salgenx flow battery today and take control of your energy future.
| CONTACT TEL: 608-238-6001 Email: greg@infinityturbine.com | RSS | AMP |