PDF Publication Title:
Text from PDF Page: 002
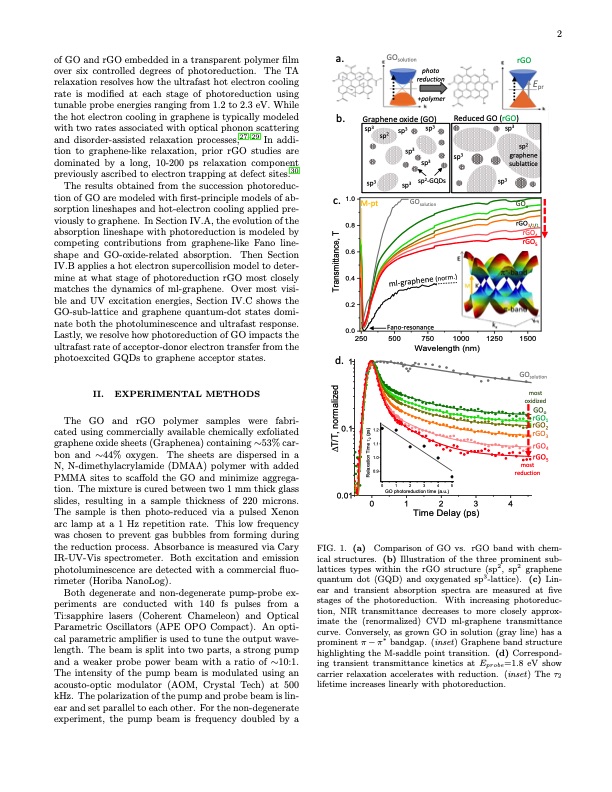
of GO and rGO embedded in a transparent polymer film a. over six controlled degrees of photoreduction. The TA relaxation resolves how the ultrafast hot electron cooling rate is modified at each stage of photoreduction using GOsolution Graphene oxide (GO) rGO Reduced GO (rGO) sp3 tunable probe energies ranging from 1.2 to 2.3 eV. While the hot electron cooling in graphene is typically modeled with two rates associated with optical phonon scattering and disorder-assisted relaxation processes,27–29 In addi- tion to graphene-like relaxation, prior rGO studies are dominated by a long, 10-200 ps relaxation component previously ascribed to electron trapping at defect sites.30 photo reduction +polymer Epr sp2 graphene sublattice sp3 GOo rGO3/2/1 rGO 4 rGO5 1500 GOsolution most oxidized GOo rGO 1 rGO2 rGO 3 rGO The results obtained from the succession photoreduc- sp3 tion of GO are modeled with first-principle models of ab- c. 1.0 M-pt sorption lineshapes and hot-electron cooling applied pre- viously to graphene. In Section IV.A, the evolution of the 0.8 absorption lineshape with photoreduction is modeled by T, competing contributions from graphene-like Fano line- e cn shape and GO-oxide-related absorption. Then Section 0.6 a ti IV.B applies a hot electron supercollision model to deter- msn mine at what stage of photoreduction rGO most closely 0.4 arT matches the dynamics of ml-graphene. Over most visi- ble and UV excitation energies, Section IV.C shows the 0.2 GO-sub-lattice and graphene quantum-dot states domi- nate both the photoluminescence and ultrafast response. 0.0 Lastly, we resolve how photoreduction of GO impacts the 250 ultrafast rate of acceptor-donor electron transfer from the photoexcited GQDs to graphene acceptor states. d. 1 II. EXPERIMENTAL METHODS dezilamr The GO and rGO polymer samples were fabri- o n) cated using commercially available chemically exfoliated ,Tsp( 0.1 1.2 2 graphene oxide sheets (Graphenea) containing ∼53% car- /Tet 1.1 DT mi bon and ∼44% oxygen. The sheets are dispersed in a n oi 1.0 ta N, N-dimethylacrylamide (DMAA) polymer with added xal e 0.9 PMMA sites to scaffold the GO and minimize aggrega- R GOsolution tion. The mixture is cured between two 1 mm thick glass slides, resulting in a sample thickness of 220 microns. The sample is then photo-reduced via a pulsed Xenon arc lamp at a 1 Hz repetition rate. This low frequency was chosen to prevent gas bubbles from forming during the reduction process. Absorbance is measured via Cary IR-UV-Vis spectrometer. Both excitation and emission photoluminescence are detected with a commercial fluo- rimeter (Horiba NanoLog). Both degenerate and non-degenerate pump-probe ex- periments are conducted with 140 fs pulses from a Ti:sapphire lasers (Coherent Chameleon) and Optical Parametric Oscillators (APE OPO Compact). An opti- cal parametric amplifier is used to tune the output wave- length. The beam is split into two parts, a strong pump and a weaker probe power beam with a ratio of ∼10:1. The intensity of the pump beam is modulated using an acousto-optic modulator (AOM, Crystal Tech) at 500 kHz. The polarization of the pump and probe beam is lin- ear and set parallel to each other. For the non-degenerate experiment, the pump beam is frequency doubled by a 012345 GO photoreduction time (a.u.) 0.01 01234 Time Delay (ps) b. sp3 sp2 sp3 sp3 sp3 sp3 sp3 sp2-GQDs Fano-resonance 500 750 1000 Wavelength (nm) 1250 FIG. 1. (a) Comparison of GO vs. rGO band with chem- ical structures. (b) Illustration of the three prominent sub- lattices types within the rGO structure (sp2, sp2 graphene quantum dot (GQD) and oxygenated sp3-lattice). (c) Lin- ear and transient absorption spectra are measured at five stages of the photoreduction. With increasing photoreduc- tion, NIR transmittance decreases to more closely approx- imate the (renormalized) CVD ml-graphene transmittance curve. Conversely, as grown GO in solution (gray line) has a prominent π − π∗ bandgap. (inset ) Graphene band structure highlighting the M-saddle point transition. (d) Correspond- ing transient transmittance kinetics at Eprobe=1.8 eV show carrier relaxation accelerates with reduction. (inset) The τ2 lifetime increases linearly with photoreduction. sp3 rGO 5 most reduction 4 2PDF Image | Graphene Oxide Photoreduction Recovers Graphene
PDF Search Title:
Graphene Oxide Photoreduction Recovers GrapheneOriginal File Name Searched:
2301-13176.pdfDIY PDF Search: Google It | Yahoo | Bing
Salgenx Redox Flow Battery Technology: Power up your energy storage game with Salgenx Salt Water Battery. With its advanced technology, the flow battery provides reliable, scalable, and sustainable energy storage for utility-scale projects. Upgrade to a Salgenx flow battery today and take control of your energy future.
| CONTACT TEL: 608-238-6001 Email: greg@infinityturbine.com | RSS | AMP |