PDF Publication Title:
Text from PDF Page: 006
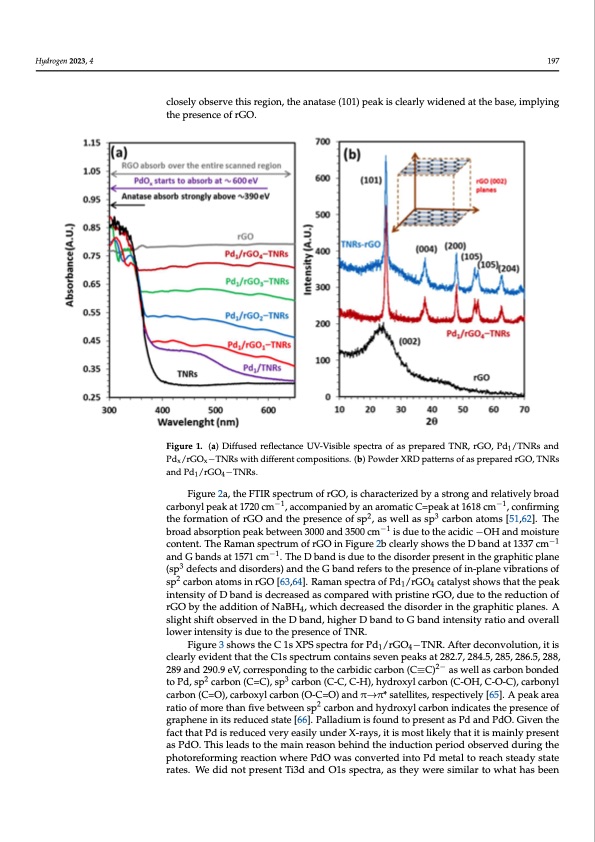
Hydrogen 2023, 4, FOR PEER REVIEW 6 support. The strong absorption in the visible region is attributed to the black color and Hydrogen 2023, 4 197 formation of the Ti−O−C bond in the hybrid support [60]. With the increase in rGO con- tent over TNRs, the absorbance is further increased. The UV-visible diffuse reflectance spectroscopy of rGO-TNRs and Pd/rGO looks exactly like Pd/rGO-TNRs and rGO alone, closely observe this region, the anatase (101) peak is clearly widened at the base, implying resptehcetpivreslyen.ce of rGO. Figure 1. (a) Diffused reflectance UV-Visible spectra of as prepared TNR, rGO, Pd1/TNRs and Figure 1. (a) Diffused reflectance UV-Visible spectra of as prepared TNR, rGO, Pd1/TNRs and Pdx/rGOx−TNRs with different compositions. (b) Powder XRD patterns of as prepared rGO, TNRs Pdx/rGOx−TNRs with different compositions. (b) Powder XRD patterns of as prepared rGO, TNRs and Pd1/rGO4−TNRs. and Pd1/rGO4−TNRs. Figure 2a, the FTIR spectrum of rGO, is characterized by a strong and relatively broad Figure 1b, the XRD pattern of rGO, exhibits a typical broad peak at 2θ = 25° (hkl = carbonyl peak at 1720 cm−1, accompanied by an aromatic C=peak at 1618 cm−1, confirming 002), which is ascribed to disordered stacks of weakly crystalline rGO nanosheets [61]. the formation of rGO and the presence of sp2, as well as sp3 carbon atoms [51,62]. The The hydrothermally prepared TNRs calcined at 400 °C show all peaks of anatase phase. broad absorption peak between 3000 and 3500 cm−1 is due to the acidic −OH and moisture T h e X R D p a t t e r n o f t h e m o s t a c t i v e p h o t o c a t a l y s t s P d 1 / r G O 4 − T N R s s h o w e d n o −o 1 b v i o u s content. The Raman spectrum of rGO in Figure 2b clearly shows the D band at 1337 cm −1 peakanodfGPbdandduseato15t7h1ecimr lo.wThceoDncbeantdraistidouneatondthehdigishordiesrperresieonnt.inTthegdriafpfrhaitcictipolnanpeeak of 3 rGO(sips sduepfepctrseassnedddibsyordaesrtsr)oangd tpheaGk boafnadnraeftearsseto(1t0h1e)pirnesethneceroefgiino-nplabneetwvieberanti2oθns=of25–30° sp2carbonatomsinrGO[63,64].RamanspectraofPd/rGO catalystshowsthatthepeak degree. If we closely observe this region, the anatas1e (1014) peak is clearly widened at the intensity of D band is decreased as compared with pristine rGO, due to the reduction of base, implying the presence of rGO. rGO by the addition of NaBH , which decreased the disorder in the graphitic planes. A 4 Figure 2a, the FTIR spectrum of rGO, is characterized by a strong and relatively slight shift observed in the D band, higher D band to G band intensity ratio and overall broad carbonyl peak at 1720 cm−1, accompanied by an aromatic C=peak at 1618 cm−1, lower intensity is due to the presence of TNR. confirming the formation of rGO and the presence of sp2, as well as sp3 carbon atoms Figure 3 shows the C 1s XPS spectra for Pd1/rGO4−TNR. After deconvolution, it is −1 [51,6cl2e]a.rTlyhevbidreonatdthabtsthoerpCt1iosnsppeectarkumbectownteaeins3s0e0v0enapnedak3s5a0t02c8m2.7, 2is84d.5u,e28t5o, 2th86e.5a,c2i8d8i,c −OH 289 and 290.9 eV, corresponding to the carbidic carbon (C≡C)2− as well as carbon bonded and moisture content. The Raman spectrum of rGO in Figure 2b clearly shows the D band 23 to Pd, sp−1 carbon (C=C), sp carbon (C−-1C, C-H), hydroxyl carbon (C-OH, C-O-C), carbonyl at 1337 cm and G bands at 1571 cm . The D band is due to the disorder present in the carbon (C=O), carboxyl carbon (O-C=O) and π→π* satellites, respectively [65]. A peak area graphitic plane (sp3 defects and disorders) and the G band refers to the presence of ratio of more than five between sp2 carbon and hydroxyl carbon indicates the presence of in-plane vibrations of sp2 carbon atoms in rGO [63,64]. Raman spectra of Pd1/rGO4 cata- graphene in its reduced state [66]. Palladium is found to present as Pd and PdO. Given the lyst shows that the peak intensity of D band is decreased as compared with pristine rGO, fact that Pd is reduced very easily under X-rays, it is most likely that it is mainly present due to the reduction of rGO by the addition of NaBH4, which decreased the disorder in as PdO. This leads to the main reason behind the induction period observed during the the pghraoptohrietfiocrmplianngerse.aActioslnigwhhtesrheiPftdoObwsearsvceodnvinerthede iDntobaPnddm, hetiaglhteorrDeacbhasntdeatdoyGstabteand in- tensity ratio and overall lower intensity is due to the presence of TNR. rates. We did not present Ti3d and O1s spectra, as they were similar to what has beenPDF Image | Enhanced Photoreforming of Oxygenates
PDF Search Title:
Enhanced Photoreforming of OxygenatesOriginal File Name Searched:
hydrogen-04-00014-v2.pdfDIY PDF Search: Google It | Yahoo | Bing
Salgenx Redox Flow Battery Technology: Power up your energy storage game with Salgenx Salt Water Battery. With its advanced technology, the flow battery provides reliable, scalable, and sustainable energy storage for utility-scale projects. Upgrade to a Salgenx flow battery today and take control of your energy future.
| CONTACT TEL: 608-238-6001 Email: greg@infinityturbine.com | RSS | AMP |