Search Gas Turbine Power for Data Center Publications search was updated real-time via Filemaker on:
Page | 012 Scale and Shape of Demand
Scale and Shape of Demand
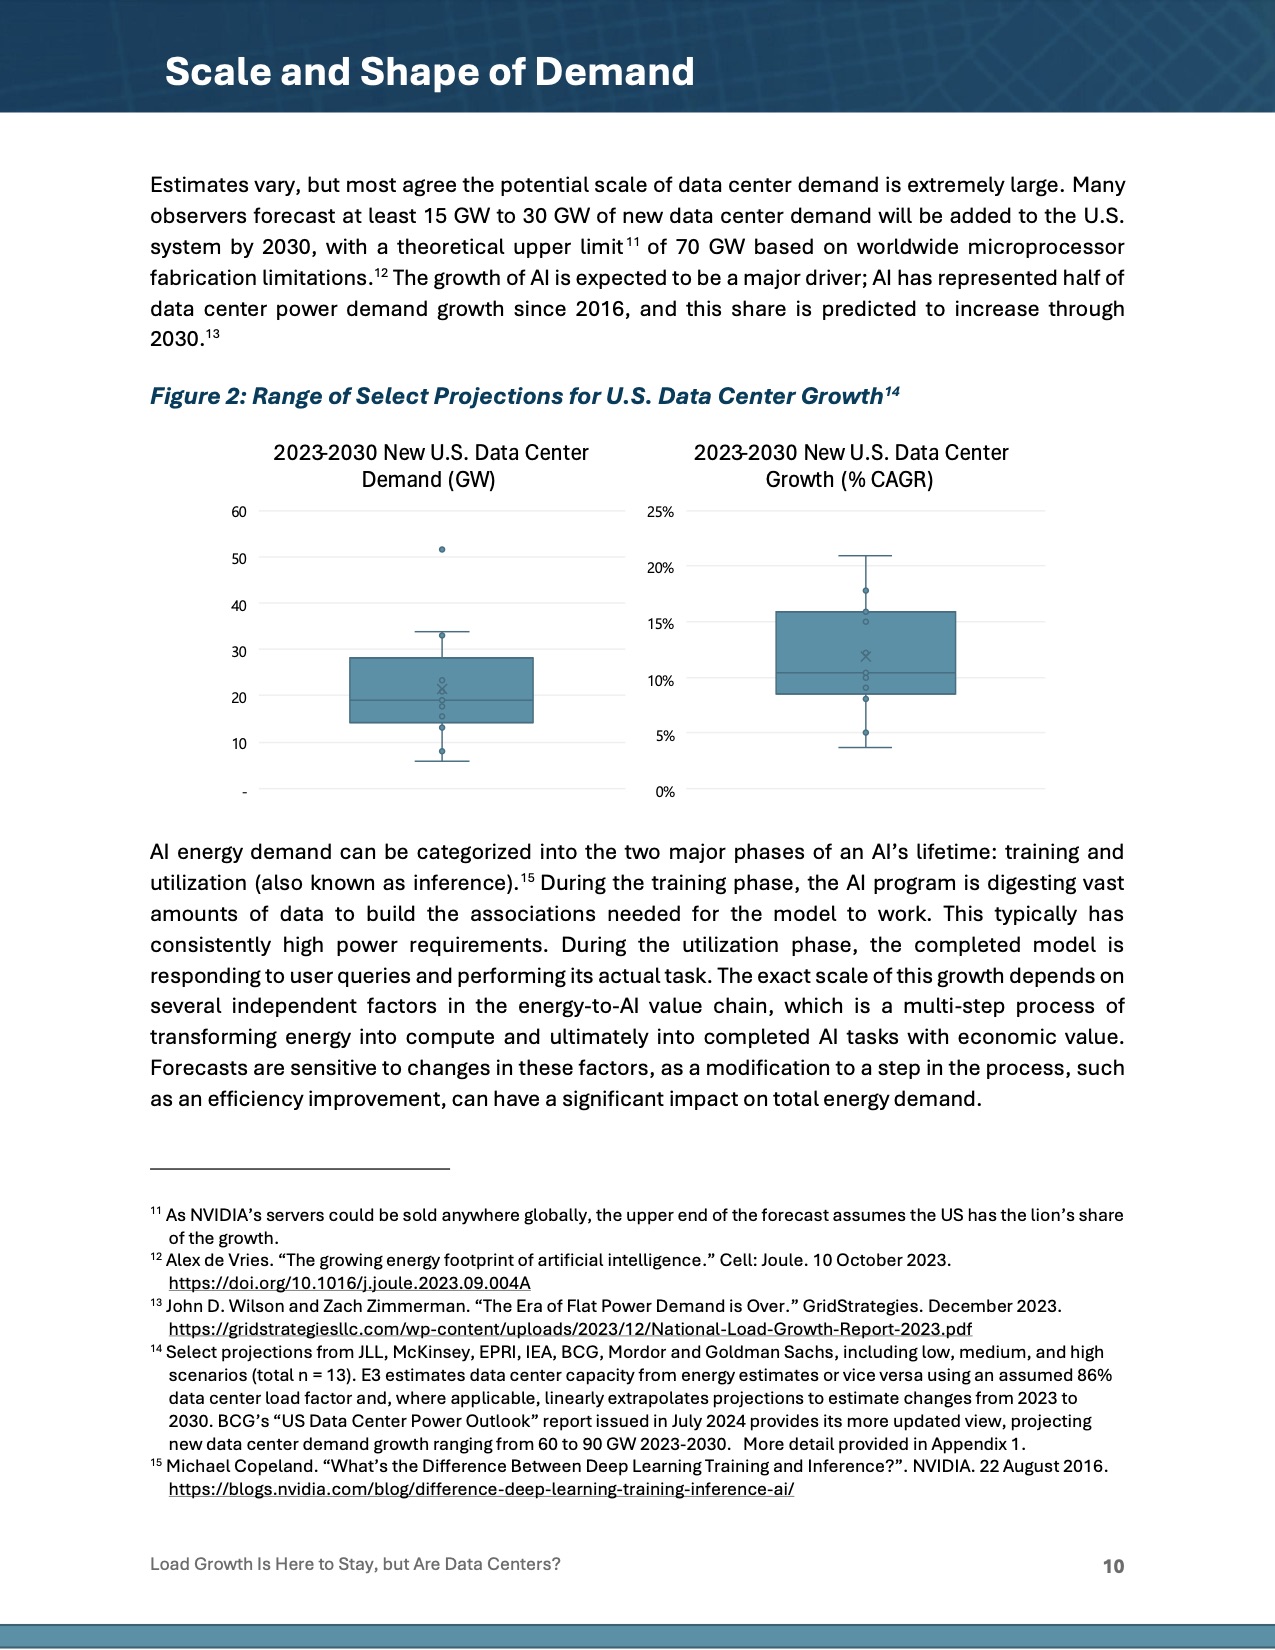
Estimates vary, but most agree the potential scale of data center demand is extremely large. Many
observers forecast at least 15 GW to 30 GW of new data center demand will be added to the U.S.
system by 2030, with a theoretical upper limit 11 of 70 GW based on worldwide microprocessor
fabrication limitations.12 The growth of AI is expected to be a major driver; AI has represented half of
data center power demand growth since 2016, and this share is predicted to increase through
2030.13
Figure 2: Range of Select Projections for U.S. Data Center Growth14
AI energy demand can be categorized into the two major phases of an AI’s lifetime: training and
utilization (also known as inference).15 During the training phase, the AI program is digesting vast
amounts of data to build the associations needed for the model to work. This typically has
consistently high power requirements. During the utilization phase, the completed model is
responding to user queries and performing its actual task. The exact scale of this growth depends on
several independent factors in the energy-to-AI value chain, which is a multi-step process of
transforming energy into compute and ultimately into completed AI tasks with economic value.
Forecasts are sensitive to changes in these factors, as a modification to a step in the process, such
as an efficiency improvement, can have a significant impact on total energy demand.
11 As NVIDIA’s servers could be sold anywhere globally, the upper end of the forecast assumes the US has the lion’s share
of the growth.
12 Alex de Vries. “The growing energy footprint of artificial intelligence.” Cell: Joule. 10 October 2023.
https://doi.org/10.1016/j.joule.2023.09.004A
13 John D. Wilson and Zach Zimmerman. “The Era of Flat Power Demand is Over.” GridStrategies. December 2023.
https://gridstrategiesllc.com/wp-content/uploads/2023/12/National-Load-Growth-Report-2023.pdf
14 Select projections from JLL, McKinsey, EPRI, IEA, BCG, Mordor and Goldman Sachs, including low, medium, and high
scenarios (total n = 13). E3 estimates data center capacity from energy estimates or vice versa using an assumed 86%
data center load factor and, where applicable, linearly extrapolates projections to estimate changes from 2023 to
2030. BCG’s “US Data Center Power Outlook” report issued in July 2024 provides its more updated view, projecting
new data center demand growth ranging from 60 to 90 GW 2023-2030. More detail provided in Appendix 1.
15 Michael Copeland. “What’s the Difference Between Deep Learning Training and Inference?”. NVIDIA. 22 August 2016.
https://blogs.nvidia.com/blog/difference-deep-learning-training-inference-ai/
Load Growth Is Here to Stay, but Are Data Centers? 10 |